

 as of 05 March 2025")
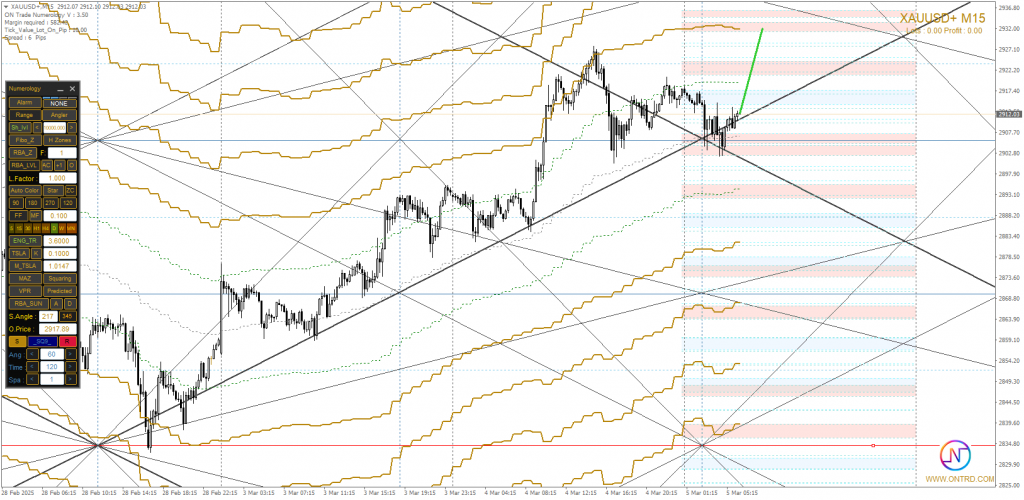
Overview of XAU/USD Performance: Gold analyze is currently trading at $2,939.60, having reached a recent high of $2,942.48 and a low of $2,936.67. The price faces significant resistance at specific levels identified through Gann Square and Fibonacci analyses, which could lead to sharp movements in upcoming sessions.
General Trend of XAU/USD Movement: Gold exhibits sharp fluctuations with a short-term upward bias, supported by strong buying momentum. Breaking the resistance at $2,944.60 may enhance the chances of rising to higher levels, while breaking the support at $2,926.60 could lead to a downward correction.
Numerical Analysis of XAU/USD Movement:
- Fibonacci Levels: The price is approaching resistance at the 78.6% level, indicating a potential reversal.
- Gann Square: Key price angles are at $2,933.67 as significant support and $2,947.50 as strong resistance.
- Digital Trend Channels: Indicate a trading range between $2,917.60 and $2,953.60 in the short term.reuters.com+7thetimes.co.uk+7litefinance.org+7
Technical Indicators for Gold analyze XAU/USD:
- Relative Strength Index (RSI): At 65, indicating bullish momentum without reaching overbought territory.
- MACD Indicator: Shows a positive crossover, reinforcing the likelihood of continued upward movement.
- Moving Averages: The price is above the 50-period moving average, confirming the upward trend.
- Trading Volume: Gradually increasing, indicating growing interest in gold as a safe haven.investopedia.com
Key Resistance Levels for XAU/USD:
| Level | Analysis |
|---|---|
| $2,953.60 | Strong resistance; breaking it may push the price toward $2,960. |
| $2,947.50 | Significant resistance; surpassing it may strengthen the bullish trend. |
| $2,944.60 | Current resistance to monitor closely. |
Key Support Levels for XAU/USD:
| Level | Analysis |
|---|---|
| $2,926.60 | Major support; breaking it may lead to a price decline. |
| $2,917.60 | Secondary support; may prevent further downturns. |
| $2,908.50 | Strong support level reflecting price movements over a longer timeframe. |
Potential Scenarios for Gold analyze XAU/USD Movement Today:
Bullish Scenario: If the price breaks above $2,944.60 and holds, further rise toward $2,947.50 and then $2,953.60 is possible. This scenario depends on sustained buying momentum and a weaker U.S. dollar.roboforex.com+1forex24.pro+1
Bearish Scenario: If the price fails to break $2,944.60 and strong selling pressures emerge, a decline toward $2,926.60 may occur. Breaking this level could open the door to further declines toward $2,917.60 and then $2,908.50.
Neutral Scenario: If trading continues within the current range of $2,926.60 – $2,944.60, sideways movements may persist until new catalysts drive the price in a clear direction.
Economic Factors Influencing XAU/USD Prices:
- Federal Reserve Policy: Any indications of interest rate hikes may pressure gold.nypost.com+6marketwatch.com+6thetimes.co.uk+6
- U.S. Dollar Movements: A stronger dollar may negatively affect gold prices.
- Safe-Haven Demand: Increasing economic concerns boost demand for gold.
- U.S. Bond Yields: Rising yields may reduce gold’s attractiveness as an investment asset.youtube.com+16marketwatch.com+16thetimes.co.uk+16
Trading Strategies and Recommendations for Gold analyze XAU/USD:
- Buying Gold: Upon breaking the $2,944.60 level, targeting $2,947.50 with a stop loss at $2,938.00.
- Selling Gold: If breaking the $2,926.60 level, targeting $2,917.60 with a stop loss at $2,932.00.
- Monitoring technical indicators and economic news is crucial for informed trading decisions.
Source: Economic News Calendar – MyFXBook
check also : Shepherd harmonic patterns
