

The Dow Jones Industrial Average (DJ30+) is one of the most closely watched stock indices in the world. Many traders rely on traditional technical and fundamental analysis to forecast market movements. However, another approach—financial astrology—has gained traction among traders seeking deeper insights into market cycles.
Financial astrology suggests that planetary movements can influence market trends. Traders who incorporate astrological insights into their analysis look at celestial alignments to identify potential turning points in price action. In this report, we merge astrology-based market insights with technical analysis to provide a unique perspective on Dowjones for March 17, 2025.
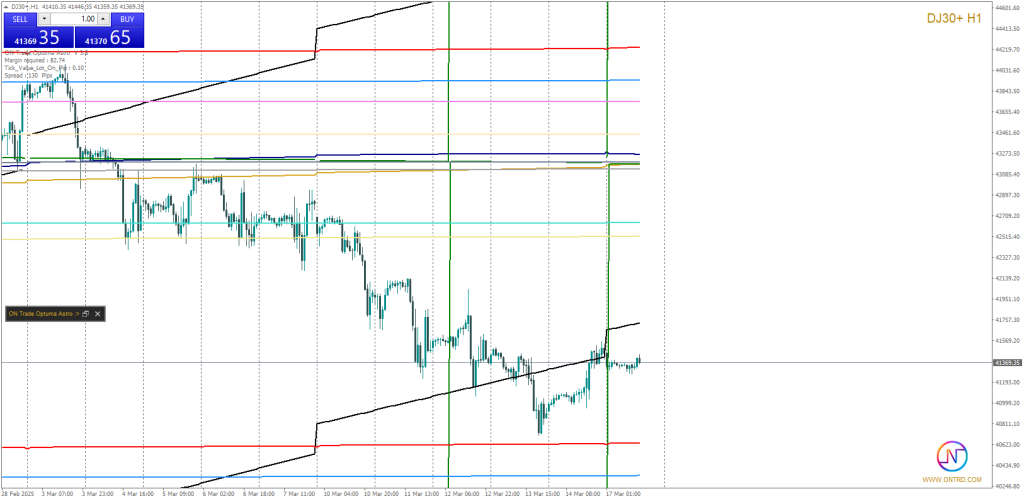
DowJones Market Overview
The Dow Jones is currently at a pivotal juncture, driven by both fundamental economic factors and astrological cycles. Understanding these elements can help traders anticipate potential price movements and capitalize on trading opportunities.
Astrological studies suggest that planetary aspects affect human psychology, which in turn influences financial markets. Historical data shows that major stock market crashes and bull runs have coincided with significant planetary alignments. Today’s analysis focuses on key support and resistance levels, potential bullish and bearish market scenarios, and astrological factors influencing Dowjones.
Key Support and Resistance Levels
Resistance Levels:
| Level | Price (USD) |
|---|---|
| R1 | 41450.00 |
| R2 | 41800.00 |
| R3 | 42300.00 |
Support Levels:
| Level | Price (USD) |
|---|---|
| S1 | 41100.00 |
| S2 | 40650.00 |
| S3 | 40250.00 |
These levels serve as critical areas where price action could either reverse or continue trending, offering key entry and exit points for traders.
Market Scenarios for Today
🔵 Bullish Scenario (Buying Opportunity)
- If Dowjones maintains support above 41100.00 and gains momentum:
- A breakout above 41450.00 could push prices towards 41800.00 – 42300.00.
- A strong close above 41800.00 on the H1/H4 chart could confirm further bullish potential.
Key Factors Supporting This Scenario:
✅ Positive investor sentiment driven by strong earnings and economic stability. ✅ Favorable planetary alignments, particularly Jupiter forming a trine with the Sun. ✅ A weakening US dollar and declining bond yields, supporting equity markets. ✅ Increased institutional buying, evident in volume analysis.
🔴 Bearish Scenario (Selling Opportunity)
- If Dowjones struggles to break 41450.00 and faces rejection:
- A drop below 41100.00 could signal further declines toward 40650.00.
- A break below 40650.00 could accelerate selling pressure toward 40250.00.
Key Factors Supporting This Scenario:
❌ Rising bond yields, making equities less attractive. ❌ Bearish astrological cycles, particularly Mercury retrograde causing uncertainty. ❌ Stronger US dollar pressuring stock indices. ❌ Formation of bearish candlestick patterns on key timeframes.
Astrological Influence on DowJones
Astrological analysis plays a crucial role in predicting market sentiment. Here are key celestial events impacting Dowjones today:
📌 Jupiter Trine Sun – This alignment is historically linked to stock market optimism and long-term growth. If fundamentals align, this could indicate a sustained uptrend.
📌 Mercury Retrograde – Typically associated with miscommunication, delays, and increased volatility. Traders should exercise caution as markets may behave unpredictably.
📌 Moon Square Mars – This aspect often leads to heightened market activity and rapid price movements. Traders should be prepared for sudden trend shifts.
📌 Saturn Conjunct Midheaven – A significant alignment indicating structural shifts in the financial sector. This may result in regulatory changes affecting market sentiment.
Economic Events Impacting Dowjones Today
Fundamental factors remain key drivers of price action. The following events could have a direct impact on Dowjones movements:
📌 Federal Reserve Policy Updates – Any hawkish or dovish comments from the Fed could trigger volatility.
📌 US Inflation Data – Inflation trends will influence interest rate expectations, impacting stock market momentum.
📌 Geopolitical Developments – Unexpected global events may increase uncertainty, causing price swings in Dowjones.
📌 Earnings Reports – Quarterly earnings from major Dow components could drive index performance.
Technical Indicators Supporting Analysis on Dowjones
Moving Averages:
- 50-day EMA: Currently acting as dynamic support near 41100.00.
- 200-day SMA: Positioned around 41800.00, serving as long-term resistance.
Relative Strength Index (RSI):
- RSI currently near 54, suggesting a neutral-to-bullish stance.
- A breakout above 60 could confirm bullish momentum.
- A drop below 40 could indicate a potential downtrend.
MACD Indicator:
- Histogram showing bullish divergence, indicating potential upside.
- A bearish crossover could signal downward pressure.
Trading Strategies for DowJones
Traders can implement different strategies based on today’s analysis:
✔️ Breakout Trading:
- Buy if price breaks 41450.00 with strong volume.
- Sell if price drops below 41100.00 with confirmation from momentum indicators.
✔️ Swing Trading:
- Consider buying near support zones 41100.00 – 40650.00 with stop-loss protection.
- Look for selling opportunities near resistance levels 41800.00 – 42300.00 if price action shows signs of exhaustion.
✔️ Astrology-Based Timing:
- Avoid trading impulsively during Mercury retrograde periods.
- Trade in alignment with Jupiter’s favorable positioning for better probability setups.
Conclusion
The Dow Jones (DJ30+) is at a crucial level, with resistance at 41450.00 and support at 41100.00 shaping today’s trading outlook. By integrating astrology-based insights with traditional technical analysis, traders can develop a well-rounded approach to market movements.
📌 Key Takeaways:
- A breakout above 41450.00 could trigger a rally toward 41800.00 – 42300.00.
- A breakdown below 41100.00 may signal declines toward 40650.00 – 40250.00.
- Pay attention to astrological aspects, such as Jupiter trine Sun and Mercury retrograde, as they historically correlate with market behavior.
- Combine astrology with technical and fundamental analysis for a comprehensive trading strategy.
Fell free to contact us for more info .
🔗 For more insights, visit:
