


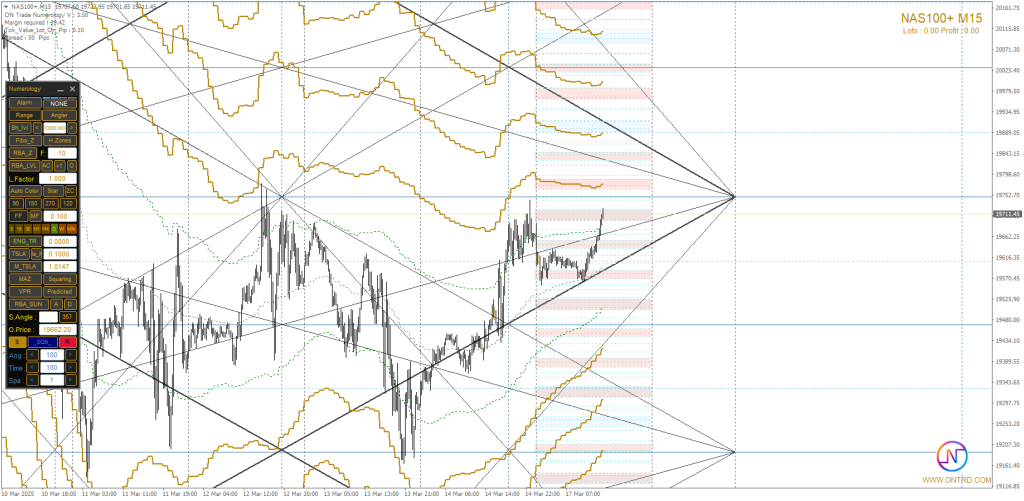
Nasdaq Chart
The Nasdaq 100 (NAS100) continues to capture traders’ attention as market dynamics shift between bullish and bearish pressures. The index’s performance is heavily influenced by macroeconomic factors, including Federal Reserve policies, tech sector earnings, and global risk sentiment. As we navigate today’s trading session, key technical levels and market sentiment will play a crucial role in determining NAS100’s next move.
Key Support and Resistance Levels by Nasdaq Analyze
Current Trends in NAS100 Markets
The NAS100 index has shown volatility in recent sessions, reacting to global economic data and investor sentiment. Traders should closely monitor key price zones for potential breakout or reversal opportunities.
Resistance Levels:
| Level | Price (USD) |
|---|---|
| R1 | 19800.50 |
| R2 | 19920.75 |
| R3 | 20050.30 |
Support Levels:
| Level | Price (USD) |
| S1 | 19650.40 |
| S2 | 19520.60 |
| S3 | 19380.20 |
Nasdaq Market Insights
The Nasdaq 100 is a leading indicator of the technology sector’s performance, often responding to shifts in monetary policy and corporate earnings. Traders should stay updated on economic reports and sector-specific developments.
Market Scenarios for Today by Nasdaq Analyze
🔵 Bullish Scenario (Buying Opportunity)
If NAS100 holds above the 19650.40 support level and builds momentum:
- A break above 19800.50 may trigger a move toward 19920.75 – 20050.30.
- Sustained buying pressure could push NAS100 to higher levels beyond 20050.30.
- The ideal confirmation for a bullish trend would be a strong close above 19800.50 on the M15 or M30 chart.
🔹 Key Factors Supporting This Scenario:
- A dovish stance from the Federal Reserve, signaling a slowdown in rate hikes.
- Positive earnings reports from major tech companies.
- Increased risk appetite in global markets, leading to higher equity inflows.
🔴 Bearish Scenario (Selling Opportunity)
If NAS100 fails to break above 19800.50 and faces resistance:
- A rejection at 19800.50 – 19920.75 could push the price lower.
- A break below 19650.40 may lead to further downside toward 19520.60.
- If selling pressure increases, NAS100 could test 19380.20, and a break below this level might open the door for deeper losses.
🔹 Key Factors Supporting This Scenario:
- Hawkish comments from the Federal Reserve indicating higher interest rates for a longer period.
- A stronger US dollar putting pressure on stock indices.
- A negative sentiment in the tech sector due to weak earnings reports or regulatory concerns.
Additional Trading Insights for Nasdaq Analyze
The NAS100 index remains a focal point for traders looking to capitalize on market fluctuations. Here are key elements to consider:
1️⃣ The Role of Economic Data & Fed Policy
- CPI and employment data impact the Fed’s rate decisions, influencing NAS100 price action.
- Lower-than-expected inflation readings could support a rally in tech stocks.
2️⃣ Market Sentiment & Risk Appetite
- Optimism in the tech sector typically boosts NAS100, while uncertainty can drive sell-offs.
- Geopolitical tensions or unexpected policy changes could increase market volatility.
3️⃣ Key Technical Patterns to Watch
- Double bottom formations near major support levels can signal potential upward reversals.
- Bearish engulfing patterns near resistance zones could indicate downside risks.
- Trendline breakouts provide strong confirmation of future price direction.
4️⃣ Economic Events & NAS100 Impact
- Watch for upcoming US economic reports, including GDP growth, job market data, and earnings from major tech firms.
- Federal Reserve statements and monetary policy updates remain key drivers of NAS100 movements.
Long-Term Outlook for NAS100
Beyond the immediate technical setup, traders and investors should consider the broader outlook for the Nasdaq 100. As a technology-driven index, its performance is closely tied to innovation trends, AI advancements, and shifts in consumer demand for digital services. Long-term investors should focus on:
- Earnings Growth: Companies like Apple, Microsoft, and NVIDIA play a crucial role in NAS100’s valuation. Monitoring earnings trends can provide insights into future market direction.
- Interest Rate Environment: Higher rates generally impact tech stocks negatively. A shift towards lower rates could provide a long-term boost to the index.
- Sector Rotation: Capital flow between defensive and growth sectors can indicate investor sentiment towards risk-taking and economic stability.
Conclusion
The Nasdaq 100 is currently at a pivotal point, with price action near significant support and resistance levels.
📌 Traders should:
- Monitor price action around 19800.50 for signs of a breakout or rejection.
- Utilize technical indicators like RSI and MACD for confirmation of entry points.
- Stay updated on macroeconomic events and earnings reports affecting the tech sector.
By applying a structured trading strategy and sound risk management, traders can effectively navigate NAS100 market fluctuations and seize potential opportunities.
For More Info Contact Us.
Check Also :
