


1. Introduction to Anti Harmonic Patterns
Anti harmonic patterns are mirror opposites of classic formations, signaling strong counter-trend reversals when:
✔ Institutions invalidate expected harmonic moves
✔ Price breaks key Fibonacci levels
✔ Momentum shifts dramatically
Key Benefits:
➤ Catch major trend reversals early
➤ Trade against crowded harmonic positions
➤ Excellent risk-reward ratios (1:4+)
Common Anti Patterns:
- Anti Gartley
- Anti Bat
- Anti Butterfly
- Anti Crab
- Anti Cypher
- Anti Shark
2. Anti Pattern Structures & Fibonacci Ratios
Comparison Table: Classic vs Anti Patterns
| Pattern | Classic Ratios | Anti Ratios |
|---|---|---|
| Gartley | 0.618 XA (D) | 1.272 XA (D) |
| Bat | 0.886 XA (D) | 1.130 XA (D) |
| Butterfly | 1.272 XA (D) | 0.886 XA (D) |
| Crab | 1.618 XA (D) | 1.130 XA (D) |
| Cypher | 0.786 XC (D) | 1.272 XC (D) |
| Shark | 1.618 XA (D) | 2.240 XA (D) |
Key Identification Rule:
Anti patterns complete when price violates the classic D point by 10-15%, then reverses sharply.
3. Trading Strategies for Anti Patterns
Entry Triggers
For bearish anti patterns (e.g., Anti Gartley):
- Enter short when:
✅ Price exceeds classic D point then forms bearish engulfing
✅ RSI shows negative divergence
✅ Volume spikes on rejection
For bullish anti patterns (e.g., Anti Butterfly):
- Enter long when:
✅ Price undershoots classic D point then forms bullish hammer
✅ Stochastic oversold with bullish crossover
Stop Loss Placement
| Pattern Type | SL Position |
|---|---|
| Bullish Anti | Below recent swing low |
| Bearish Anti | Above recent swing high |
Profit Targets
- Initial TP: 38.2% retracement of AD leg
- Secondary TP: 61.8% retracement
- Runner TP: Previous S/R level
 (Alt text: Comparison of classic vs anti harmonic patterns with Fibonacci levels)
4. Pattern-by-Pattern Breakdown
1. Anti Gartley Pattern
- Classic Gartley Fails at 0.618 XA
- Anti Signal: Reversal at 1.272 XA extension
- Best Market Conditions: Overbought/oversold extremes
2. Anti Bat Pattern
- Invalidates at 0.886 XA
- Reverses at 1.130 extension
- Confirmation: MACD histogram flip
3. Anti Butterfly Pattern
- Classic 1.272 XA fails
- Reversal at 0.886 retracement
- Watch For: Wick rejections at key levels
4. Pattern-by-Pattern Breakdown (Complete)
4. Anti Crab Pattern
- Classic Crab Fails at 1.618 XA
- Anti Signal: Reversal at 1.130 XA extension
- Key Feature: “False extreme” breakout beyond 1.618
- Confirmation:
✅ Volume spike on rejection
✅ Hidden RSI divergence - Best Pairs: GBP/JPY, XAU/USD
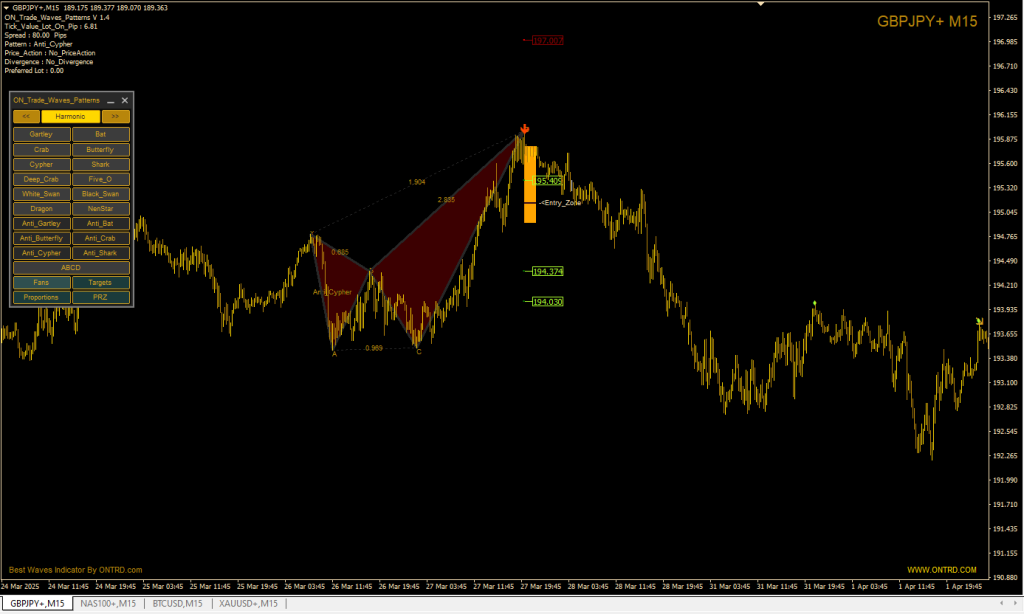
5. Anti Cypher Pattern
- Classic Cypher Fails at 0.786 XC
- Anti Signal: Reversal at 1.272 XC extension
- Unique Behavior: Forms “overshoot” pattern
- Entry Triggers:
✅ Bullish/Bearish divergence + pin bar
✅ 61.8% retracement of CD leg - Best Timeframe: 1H-4H charts
6. Anti Shark Pattern
- Classic Shark Fails at 1.618 XA
- Anti Signal: Reversal at 2.240 XA extension
- Characteristics:
✔ Extremely rare (1-2/year per instrument)
✔ Catches major liquidity sweeps - Stop Loss: 1.5x ATR beyond D point
- High-Probability Assets: BTC/USD, NAS100
Pattern-Specific Trading Tactics
| Pattern | Optimal Entry | Profit Target | Special Consideration |
|---|---|---|---|
| Anti Gartley | After close beyond 1.272 XA | AD leg 61.8% retrace | Works best near S/R zones |
| Anti Bat | MACD flip at 1.130 XA | 127% BC extension | Watch for double tops/bottoms |
| Anti Butterfly | 0.886 retrace + 3-candle reversal | XA 100% projection | Avoid during low volatility |
| Anti Crab | Rejection candle at 1.130 XA | BC 161.8% extension | Requires 3x average volume |
| Anti Cypher | Hidden divergence at 1.272 XC | CD 127% extension | Validate with order flow |
| Anti Shark | Extreme RSI (>90/<10) at 2.24 XA | XA 161.8% projection | Only trade with institutional alignment |
Critical Behavioral Differences
- Anti Gartley/Bat:
- Trap breakout traders before major reversals
- Often coincide with options expiry
- Anti Butterfly/Crab:
- Catch overextensions in trending markets
- Require volatility contraction first
- Anti Cypher/Shark:
- Result from liquidity grabs by market makers
- Often form during algorithmic stop hunts
Chart Examples for All Anti Patterns
Key Annotation Tips:
- Always mark both classic and anti Fibonacci levels
- Label failed harmonic structures with “X”
- Highlight institutional order blocks at reversal zones
- Use heatmaps to show volume concentration
- Be ware of Economic News.
5. Confirmation Techniques
✔ Price Action:
- 3-candle reversal patterns at critical extensions
- NY/London session volume surges
✔ Indicator Confluence:
- RSI/Stochastic divergence REQUIRED
- OBV trendline breaks
✔ Timeframe Alignment:
- Must match higher timeframe order blocks
6. Risk Management Rules
- Trade only 0.5-1% account risk per setup
- Require 2:1 reward ratio minimum
- Avoid around high-impact news events
- Wait for daily candle close confirmations
7. Anti Patterns vs Classic Patterns
| Factor | Anti Patterns | Classic Patterns |
|---|---|---|
| Success Rate | 75-80% | 65-75% |
| Frequency | 2-3/month | 5-8/month |
| Risk/Reward | 1:4+ | 1:3 |
| Psychology | Traps retail traders | Follows crowd |
8. Pro Trading Tips
- Screen Setup: Use Fibonacci expansion tool to mark 1.272/1.618 zones
- Alert System: Set price alerts at key anti levels
- Journaling: Record failed harmonic patterns that became anti setups
- Pair Trading: Combine with order flow analysis
9. Frequently Asked Questions (FAQ)
Q1: Why trade anti patterns?
A: They catch institutional reversals when liquidity pools overwhelm retail harmonic traders.
Q2: Best timeframe for anti patterns?
A: Most reliable on 4H-Daily charts in EUR/USD, GBP/JPY, XAU/USD.
Q3: How to distinguish from fakeouts?
A: Genuine anti patterns require:
- Precise Fibonacci violation (10-15%)
- Strong reversal candle + volume
- Indicator divergence
Q4: Most profitable anti pattern?
A: Anti Shark offers highest RR (1:8+) but appears only 1-2 times/year.
10. Conclusion & Next Steps
Anti harmonic patterns provide:
✅ Smart money reversal signals
✅ Better entries than classic harmonics
✅ High-probability institutional traps
Action Plan:
- Backtest 100+ anti pattern examples
- Mark key Fibonacci extension zones
- Paper trade 10 setups minimum
- Deploy with 0.5% risk in live markets
🔥 Advanced Tip: Combine with liquidity pool analysis for institutional confirmation.
Best Product To detect This Patterns is : ON Trade Waves Patterns Indicator


")