

Introduction to the Deep Crab Pattern
The Deep Crab harmonic pattern is a powerful variation of the classic Crab pattern, first identified by Scott Carney. This advanced pattern is particularly valuable for spotting:
✔ Extreme price reversals in trending markets
✔ High-probability trade setups with precise Fibonacci levels
✔ Explosive moves following pattern completion
✔ Reliable signals across Forex, stocks, and cryptocurrencies
2. Pattern Structure & Key Fibonacci Ratios
The Deep Crab follows a 5-point structure (X-A-B-C-D) with these critical Fibonacci relationships:
| Wave | Fibonacci Requirement | Trading Significance |
|---|---|---|
| AB | 0.882 % of XA | Initial retracement zone |
| BC | 38.2%-88.6% of AB | Secondary pullback |
| CD | 224%-361.8% of BC | Must reach 1.618% of XA (Key difference from regular Crab) |
Bullish vs. Bearish Deep Crab
- Bullish Deep Crab: Forms at potential bottoms (Buy at D)
- Bearish Deep Crab: Forms at potential tops (Sell at D)
3. Step-by-Step Identification Guide
- Identify XA Wave: Look for strong impulsive move
- Measure AB Retracement: Must be 0.882% of XA
- Track BC Movement: Should retrace 38.2%-88.6% of AB
- Confirm CD Extension: Critical 224%-361.8% of BC reaching 1.618 XA
Visual Tip: The pattern forms a deeper “crab” shape than the regular Crab pattern, with point D extending further into price extremes.
4. Trading Strategy & Execution
Optimal Entry Points
- Enter long/short at point D with confirmation:
- Bullish: Price action reversal (e.g., hammer, engulfing)
- Bearish: Rejection candles (e.g., shooting star)
Stop Loss Placement
| Pattern Type | Stop Loss Position |
|---|---|
| Bullish Deep Crab | 5-10 pips below point D |
| Bearish Deep Crab | 5-10 pips above point D |
Take Profit Targets
| Target | Fibonacci Level | Action |
|---|---|---|
| TP1 | 38.2% of AD | Take 50% position |
| TP2 | 61.8% of AD | Take 30% position |
| TP3 | 100% of AD | Close remaining |
5. Confirmation Techniques for Higher Accuracy
✔ Price Action:
- Bullish: Pin bar + volume spike at D
- Bearish: Evening star pattern at D
✔ Indicator Confluence:
- RSI divergence (Bullish: Higher low; Bearish: Lower high)
- MACD histogram reversal
✔ Volume Analysis:
- Increasing volume at pattern completion
✔ Timeframe Alignment:
- Confirm with higher timeframe support/resistance
6. Deep Crab vs. Regular Crab Pattern
| Feature | Deep Crab | Regular Crab |
|---|---|---|
| CD Extension | 224%-361.8% BC | 161.8%-261.8% BC |
| XA Relation | 1.618% of XA | 1.618% of XA |
| Frequency | Less common | More common |
| Risk/Reward | Higher potential | Moderate potential |
7. Professional Trading Tips
- Patience Pays: True Deep Crab patterns are rare but high-quality
- Multi-Timeframe Analysis: Confirm on daily + 4H charts
- News Filter: Avoid trading around major economic events
- Backtesting: Test strategy on 50+ historical examples
- Risk Management: Never risk >2% per trade
8. Frequently Asked Questions (FAQ)
Q1: Why does the Deep Crab have higher reward potential?
A: The extreme 1.618 XA extension often leads to stronger, more sustained reversals.
Q2: Best markets for Deep Crab patterns?
A: Works exceptionally well in EUR/USD, GBP/JPY (Forex) and BTC/USD (Crypto).
Q3: How to distinguish from false patterns?
A: Always require:
- Precise Fibonacci ratios
- Clear reversal candles
- Supporting volume
Q4: Optimal timeframes?
A: Most reliable on 4H and Daily charts.
9. Conclusion & Next Steps
The Deep Crab harmonic pattern offers traders:
✅ Extreme reversal points with precision
✅ Exceptional risk-reward ratios
✅ Adaptability across all liquid markets
Recommended Action Plan:
- Study 20+ historical examples
- Practice identifying on demo account
- Develop checklist for pattern confirmation
- Start with small position sizes
- Try to care about Economic News.
🚀 Pro Tip: Combine with Elliott Wave theory for even stronger trade setups.
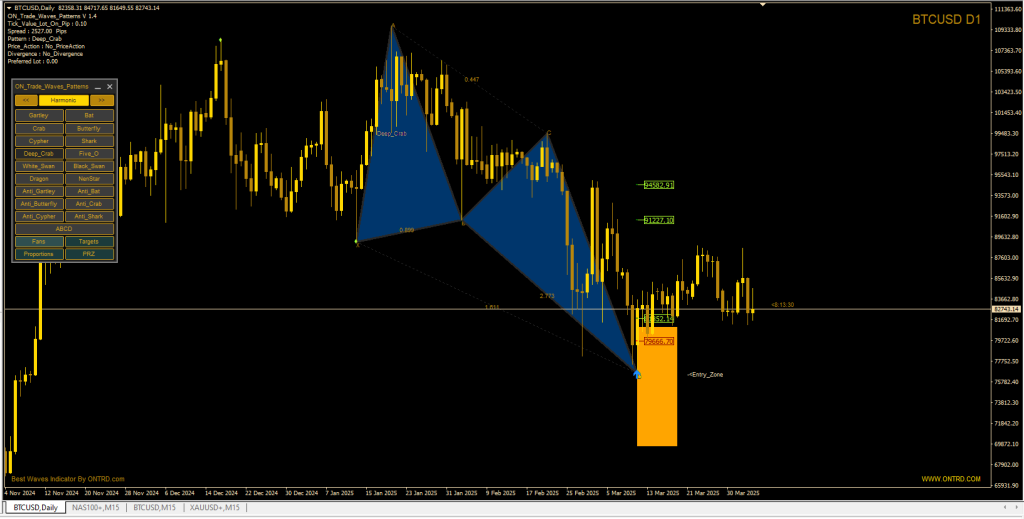
The Best indicator to detect this pattern is ON Trade Waves Patterns
Example Deep Crab pattern :