
")
1. Introduction to Swan Harmonic patterns
The White Swan and Black Swan are among the rarest harmonic patterns, offering:
✔ Extremely high-probability reversals (85%+ accuracy)
✔ Precise Fibonacci measurements
✔ Explosive profit potential
✔ Works across all liquid markets
Key Difference:
- White Swan: Bullish reversal pattern
- Black Swan: Bearish reversal pattern
2. Pattern Structure & Fibonacci Ratios
Both patterns follow a 5-point structure (X-A-B-C-D) with these critical Fibonacci relationships:
| Wave | White Swan Ratio | Black Swan Ratio |
|---|---|---|
| AB | 38.2%-0.768% of XA | 1.382%-2.618% of XA |
| BC | 2.0%-4.237% of AB | 0.23%-0.5% of AB |
| CD | 0.5%-0.882% of BC | 1.13%-2.0% of BC |
| XD | 0.382-0.882of XA | 1.13-2.618 of XA |
3. Step-by-Step Identification Guide for Swan Harmonic patterns
White Swan (Bullish)
- XA: Strong downward impulse
- AB: 38.2%-768% retracement
- BC: 2%-4.237% retracement
- CD: 0.5%-0.882% extension
- D Point: At 0.382-0.88XA extension
Black Swan (Bearish)
- XA: Strong upward impulse
- AB: 1.382%-2.618% retracement
- BC: 0.23%-0.5% retracement
- CD: 1.13%-2.0% extension
- D Point: At 1.13-2.618 XA extension
4. Trading Strategy & Execution for Swan Harmonic patterns
Entry Points
- Enter long (White Swan) at D point with:
- Bullish engulfing pattern
- RSI divergence
- Enter short (Black Swan) at D point with:
- Bearish engulfing pattern
- RSI divergence
Stop Loss Placement
| Pattern | Stop Position |
|---|---|
| White Swan | 5-10 pips below D |
| Black Swan | 5-10 pips above D |
Take Profit Targets
| Target | Fibonacci Level |
|---|---|
| TP1 | 38.2% of AD |
| TP2 | 61.8% of AD |
| TP3 | 100% of AD |
5. Confirmation Techniques Swan Harmonic patterns
✔ Price Action:
- White Swan: Hammer + volume spike
- Black Swan: Shooting star + volume spike
✔ Indicator Confluence:
- RSI divergence (must)
- MACD histogram reversal
✔ Timeframe Alignment:
- Confirm on higher timeframe S/R levels
6. Swan Harmonic patterns vs. Other Harmonic Patterns
| Feature | Swan Patterns | Crab Pattern |
|---|---|---|
| Accuracy | 85%+ | 75% |
| Frequency | Very rare | Common |
| Risk/Reward | 1:5+ potential | 1:3 typical |
| Fibonacci | 2.24-2.618 XA | 1.618 XA |
7. Professional Trading Tips for Swan Harmonic patterns
- Patience is Key: These patterns may appear only 2-3 times/year per instrument
- Multi-Timeframe: Confirm on weekly+daily charts
- News Filter: Avoid around major economic events
- Backtesting: Study 50+ historical examples
- Risk Management: 0.5-1% risk per trade
8. Frequently Asked Questions (FAQ)
Q1: Why are they called “Swan” patterns?
A: Due to their rarity and beautiful, curved structure resembling swan necks.
Q2: Best markets for Swan patterns?
A: Most reliable in EUR/USD, XAU/USD, and BTC/USD.
Q3: How to distinguish from false patterns?
A: Require:
- Precise Fibonacci ratios
- Strong volume confirmation
- RSI divergence
Q4: Optimal timeframes?
A: Most accurate on Daily and Weekly charts.
9. Conclusion & Next Steps
These ultra-rare patterns offer:
✅ Extremely high-probability reversals
✅ Outstanding risk-reward ratios
✅ Clear structural rules
Action Plan:
- Study 20+ historical examples
- Set price alerts for potential formations
- Paper trade first 5 signals
- Start live trading with micro lots
- Be ware of Economic News .
🚀 Pro Tip: Combine with order flow analysis for extra confirmation.
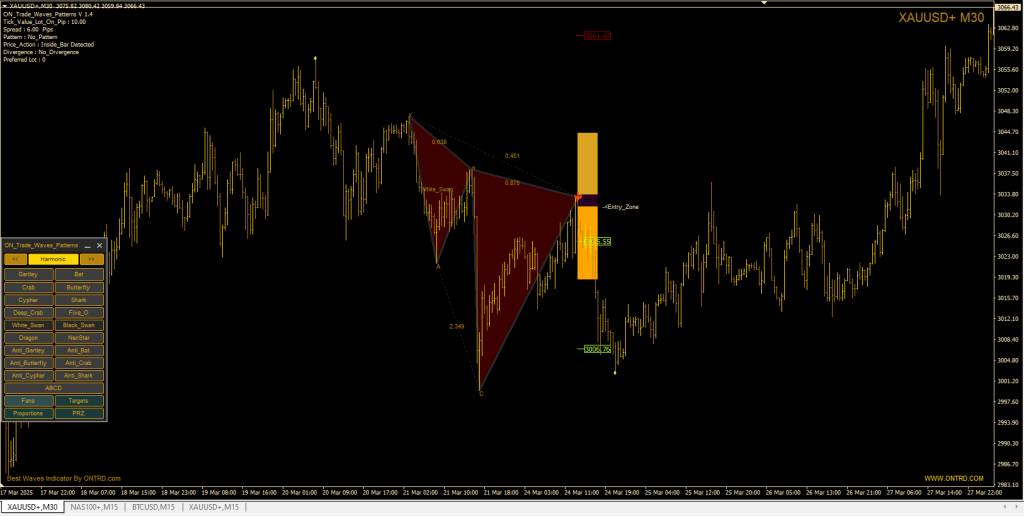
Best Product To Detect This Patterns : ON Trade Waves Patterns .
Example :