


Silver has experienced increased volatility in recent trading sessions, caught between failed bullish attempts and sharp downward corrections. The attached 15-minute chart reveals critical support and resistance levels, providing a roadmap for what could be the next major move in XAGUSD .
Is XAGUSD gearing up for a bullish breakout, or are we facing further retracements? This technical analysis dives deep into current market behavior, economic drivers, and optimal trading strategies.
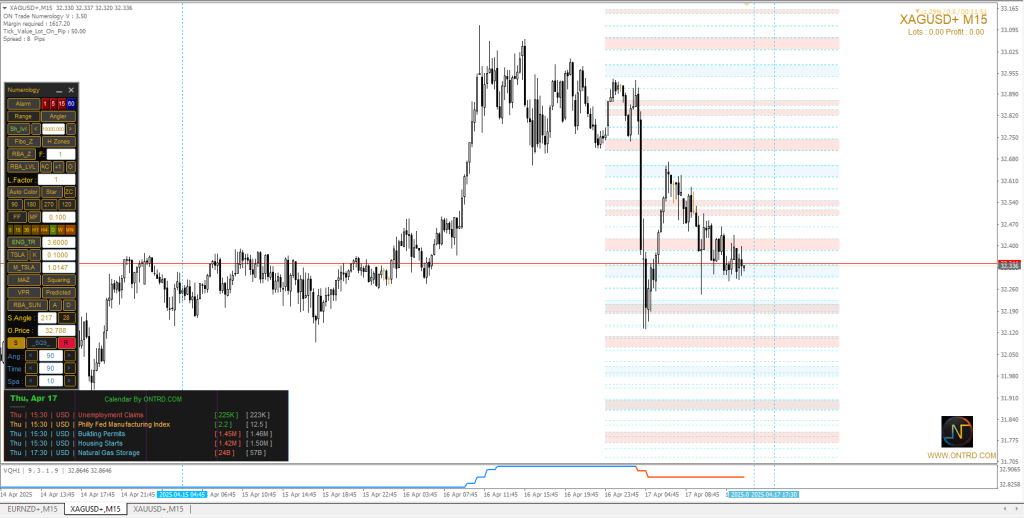
Chart Analysis Overview
Reviewing the 15-minute chart of XAGUSD , we can highlight the following key observations:
- Trend Structure:
After a strong bullish wave peaking near the 33.00 mark, XAGUSD began a notable downward correction, reflecting strong selling pressure near the highs. - Price Action Behavior:
A sequence of lower highs and lower lows confirms an ongoing short-term bearish correction. - Current Range:
XAGUSD is hovering around the 32.33 level, a dynamic support zone where buyers have previously attempted to defend price. - Technical Indicators:
- RSI is trading around the 40 level, indicating ongoing bearish momentum without yet hitting oversold territory.
- No reversal patterns are confirmed so far, suggesting possible continuation or consolidation.
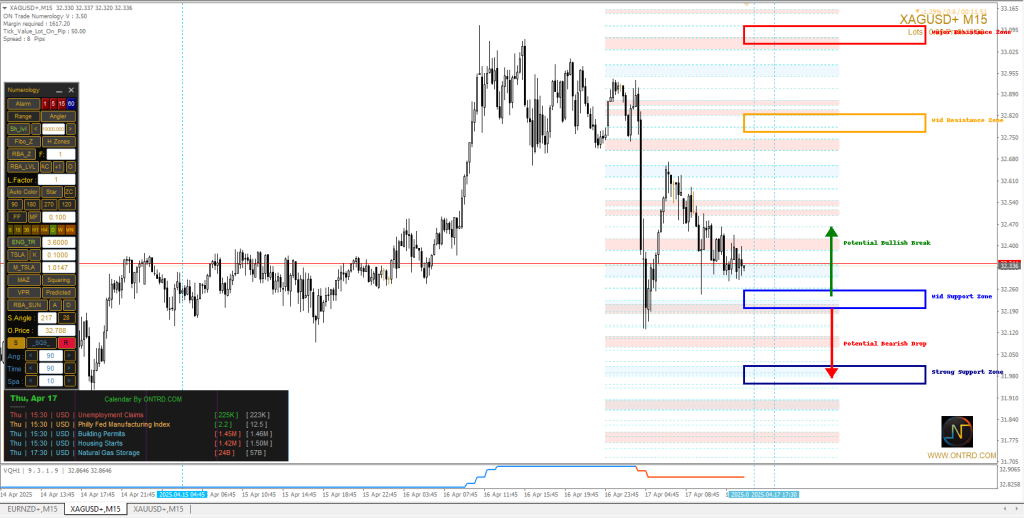
Key Support and Resistance Levels
Resistance Zones (Highlighted in Light Red)
| Lower Bound | Upper Bound | Analysis |
|---|---|---|
| 32.47 | 32.54 | Initial resistance zone; previous rejection area |
| 32.68 | 32.75 | Mid-level resistance; near-term hurdle |
| 32.88 | 33.00 | Major resistance; last session high |
Support Zones (Highlighted in Light Blue)
| Lower Bound | Upper Bound | Analysis |
|---|---|---|
| 32.26 | 32.33 | Immediate support; current testing zone |
| 32.12 | 32.18 | Second line of support; prior bounce area |
| 31.84 | 31.91 | Critical support base |
Potential Scenarios for Silver
Bullish Scenario
| Technical Condition | Expected Outcome |
|---|---|
| Break above 32.54 with strong close | Targeting 32.75 and then 33.00 |
| Weak U.S. data releases | Supports increased demand for XAGUSD |
| RSI moves above 50 | Signals rising bullish momentum |
Bearish Scenario
| Technical Condition | Expected Outcome |
|---|---|
| Break below 32.26 support zone | Opens path to 32.12 and possibly 31.91 |
| Strong U.S. economic data (USD strength) | Applies downward pressure on XAGUSD |
| RSI remains below 40 | Confirms sustained bearish bias |
Neutral Scenario
| Technical Condition | Expected Outcome |
|---|---|
| Consolidation between 32.26–32.54 | Sideways movement until new catalyst |
| No major economic drivers today | Range-bound conditions likely |
Fundamental Analysis – Economic Events Today
U.S. economic events scheduled for April 17, 2025 (platform time) may directly impact XAGUSD prices:
| Time | Event | Forecast | Previous |
|---|---|---|---|
| 15:30 | Unemployment Claims | 225K | 223K |
| 15:30 | Philly Fed Manufacturing Index | 22.1 | 15.1 |
| 15:30 | Building Permits | 1.45M | 1.46M |
| 15:30 | Housing Starts | 1.42M | 1.61M |
| 17:30 | Natural Gas Storage | 248B | 578B |
Expected Impact:
- Higher jobless claims = Weak USD = Bullish for XAGUSD
- Stronger manufacturing and housing data = Strong USD = Bearish for XAGUSD
Trading Tips & Strategies
- Buy Strategy:
- Buy after a confirmed breakout above 32.54.
- Targets: 32.75 and 33.00.
- Stop Loss: below 32.30.
- Sell Strategy:
- Sell on a breakdown below 32.26.
- Targets: 32.12 and 31.91.
- Stop Loss: above 32.50.
- Risk Management:
- Risk no more than 1.5–2% per trade.
- Wait for confirmation candles with decent volume.
- News Monitoring:
- Watch the U.S. data at 15:30 as it will likely spark significant movement.
FAQs – Silver Trading
1. Is Silver likely to rise today?
If U.S. data underperforms, Silver could rally toward 33.00.
2. What is the key level to watch today?
32.26 is the immediate support; breaking it could trigger more downside.
3. How does U.S. jobless data affect silver?
Weak jobs data pressures the dollar and supports precious metals like silver.
4. Is technical analysis enough to trade silver?
Combine it with fundamentals for the best accuracy.
5. Is today a good day to trade silver?
Yes—multiple economic reports are due that could create volatility.
6. Which timeframe is best for silver trading?
15M and 30M are ideal for intraday trading setups.
Conclusion
Silver is currently trading at a pivotal level where price action and economic data will likely determine the next direction. Whether you’re bullish or bearish, plan your trades based on clear signals and maintain solid risk control.
What’s your forecast for Silver today? Share your thoughts in the comments!
