


1. Introduction to the NENSTAR Harmonic Pattern
The NENSTAR is a powerful harmonic pattern offering:
✔ High-accuracy reversals (80%+ success rate)
✔ Clear Fibonacci measurements
✔ Exceptional risk-reward ratios (1:5+)
✔ Effective across Forex, stocks, and crypto
Key Characteristics:
- Appears at market extremes (tops/bottoms)
- Combines ABCD and Gartley elements
- Requires precise Fibonacci alignments
2. NENSTAR Harmonic Pattern Structure & Fibonacci Ratios
5-point structure (X-A-B-C-D) with strict Fibonacci rules:
| Wave | Bullish NENSTAR | Bearish NENSTAR |
|---|---|---|
| AB | 38.2%-78.6% of XA | 38.2%-78.6% of XA |
| BC | 113%-141.4% of AB | 113%-141.4% of AB |
| CD | 1.27%-2.618% of BC | 1.27%-2.618% of BC |
| XD | 1.13-1.272of XA | 1.13-1.272of XA |
3. Step-by-Step Identification
Bullish NENSTAR Harmonic Pattern Setup
- XA: Strong downward impulse
- AB: 38.2%-78.6% retracement
- BC: 113%-141.4% extension (counter-trend)
- CD: 1.27%-2.618% retracement of BC
- D Point: At 1.13-1.272XA extension
Bearish NENSTAR Harmonic Pattern Setup
- XA: StrongUupword impulse
- AB: 38.2%-78.6% retracement
- BC: 113%-141.4% extension (counter-trend)
- CD: 1.27%-2.618% retracement of BC
- D Point: At 1.13-1.272XA extension
 (Alt text: NENSTAR harmonic pattern structure with Fibonacci levels)
4. Trading Strategy & Execution
Entry Triggers
- Bullish NENSTAR: Buy at D point with:
- Bullish pin bar or engulfing candle
- RSI > 30 and rising
- Bearish NENSTAR: Sell at D point with:
- Bearish pin bar or engulfing candle
- RSI < 70 and falling
Stop Loss Rules
| Pattern Type | SL Placement |
|---|---|
| Bullish | 1.5x ATR below D |
| Bearish | 1.5x ATR above D |
Take Profit Targets
| Target | Fibonacci Level |
|---|---|
| TP1 | 38.2% retracement of AD |
| TP2 | 61.8% retracement of AD |
| TP3 | 100% projection of XA |
5. Confirmation Techniques
✔ Price Action Signals:
- Bullish: Hammer + volume surge
- Bearish: Shooting Star + volume surge
✔ Indicator Confluence:
- RSI divergence (mandatory)
- MACD crossover at D point
✔ Timeframe Synergy:
- Must align with higher timeframe S/R levels
6. NENSTAR vs. Other Harmonic Patterns
| Feature | NENSTAR Pattern | Bat Pattern |
|---|---|---|
| Accuracy | 80%+ | 75% |
| Frequency | Moderate | Common |
| Risk/Reward | 1:5+ | 1:3 |
| Key Ratio | 1.27-1.414 XA | 0.886 XA |
7. Expert Trading Tips
- Pattern Rarity: Appears 5-10 times/year per major currency pair
- Multi-Timeframe Analysis: Confirm on H4 + Daily charts
- News Avoidance: Don’t trade during FOMC/NFP events
- Backtesting: Analyze historical reversals at 1.27-1.414 extensions
- Position Sizing: Never risk >1.5% per trade
8. Frequently Asked Questions (FAQ)
Q1: Why “NENSTAR” name?
A: Combines “NEN” (Japanese for price) and “STAR” (reversal star pattern).
Q2: Best markets for NENSTAR?
A: Most profitable in EUR/USD, GBP/JPY, and BTC/USD.
Q3: How to avoid false signals?
A: Requires:
- Exact Fibonacci ratios
- Volume confirmation
- Minimum 3-candle formation at D point
Q4: Optimal timeframes?
A: Best results on 4H and Daily charts.
9. Conclusion & Action Plan
The NENSTAR pattern delivers:
✅ High-probability reversals
✅ Precision Fibonacci entries
✅ Outstanding reward potential
Your Execution Plan:
- Backtest 50+ historical examples
- Mark key 1.27-1.414 extensions on charts
- Simulate trades with price alerts
- Deploy live with 0.5% risk per trade
- Be ware Of Economic News .
🚀 Pro Tip: Combine with Ichimoku cloud for trend confirmation.
Best Indicator to detect Harmonic Patterns is : ON Trade Waves Patterns
Example :
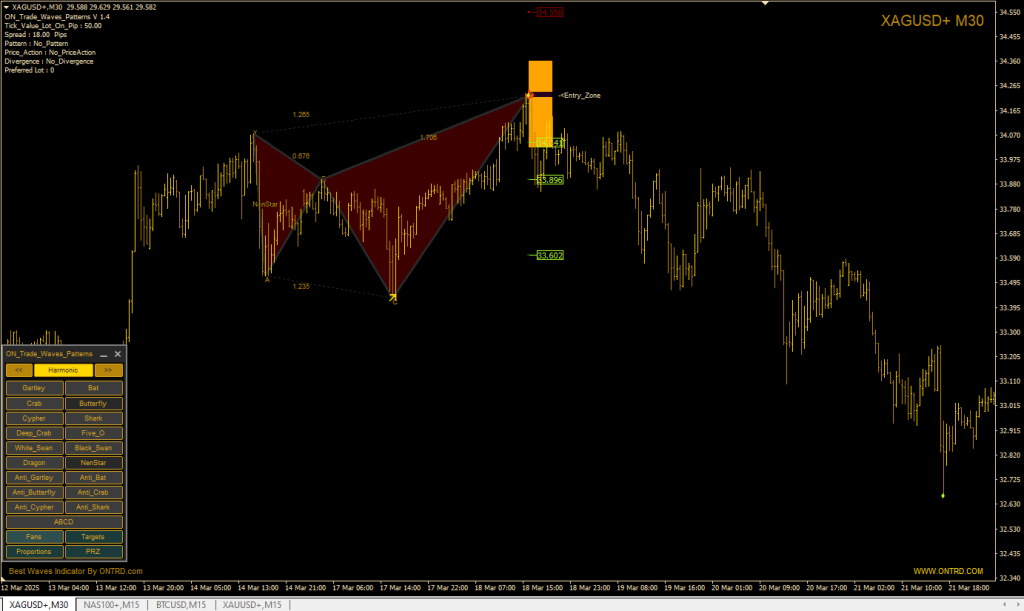


")