Description
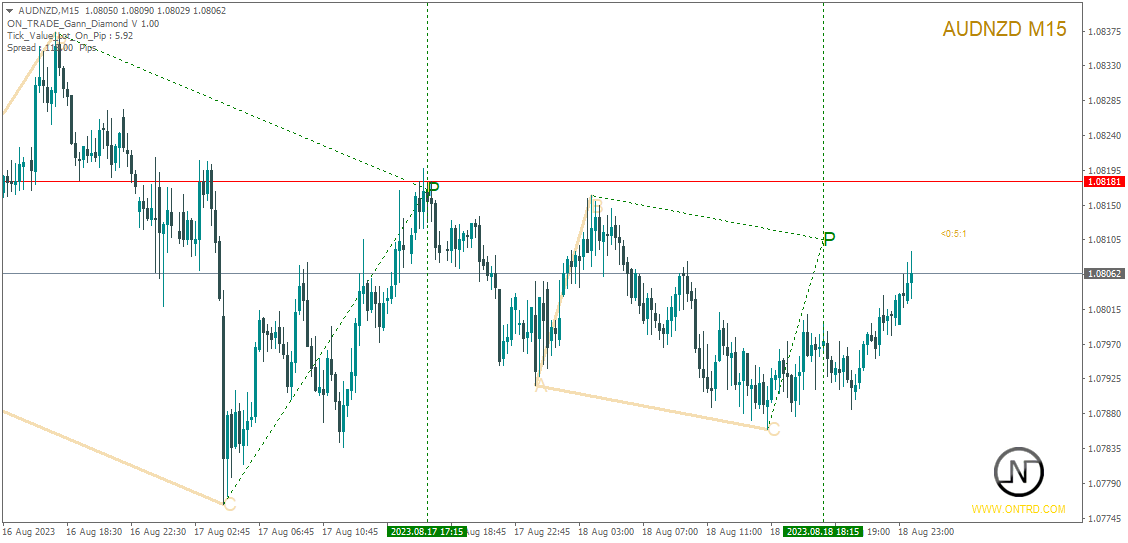
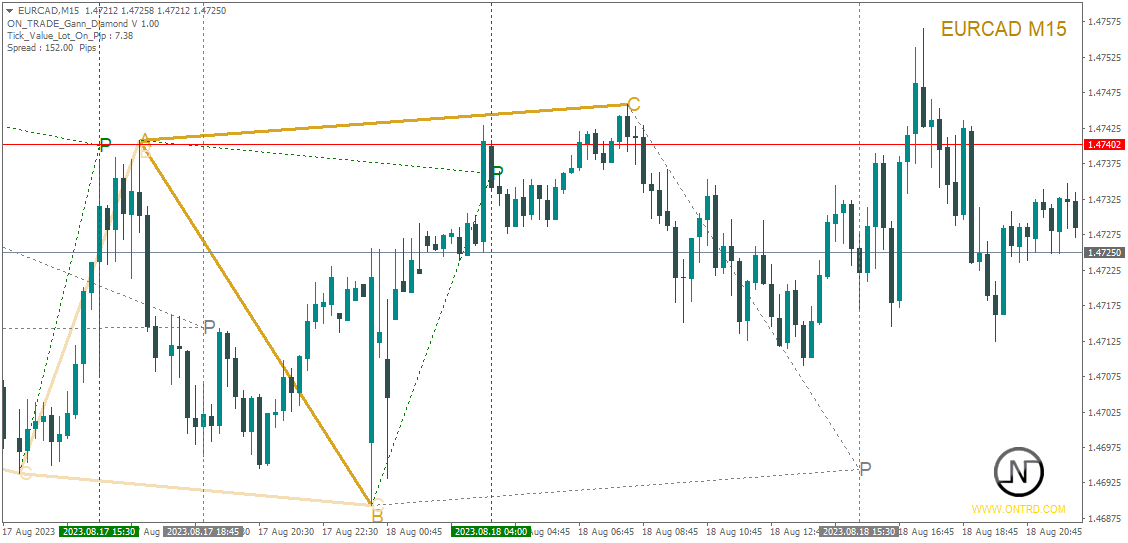
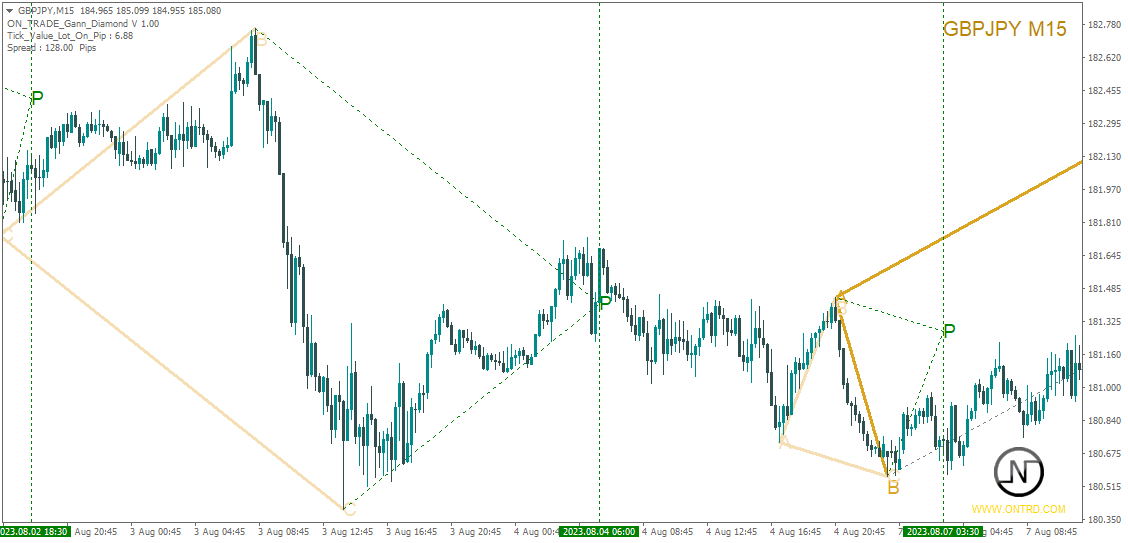
The indicator is designed to detect and visualize diamond Gann waves, a specific pattern derived from Gann theory. It provides traders with insights into potential market reversals by drawing points (P) based on the ABC points of the pattern. Additionally, the indicator draws vertical lines from the predicted points (P) to help traders identify potential reversal points more easily.
Indicator Features:
- Use_System_Visuals: This parameter enables or disables the usage of the system’s visual themes for the indicator’s appearance. By enabling this option, the indicator’s visual elements will be consistent with the overall theme of the trading platform.
- Show_Last_Candle_Counter: Enabling this option displays a counter that indicates the time remaining for the current candlestick to close. This timer can be helpful for traders who rely on specific candlestick patterns or time intervals for their trading strategies.
- Candle_Counter_Color: Traders can customize the color of the candle counter text, enhancing the indicator’s visual clarity and alignment with the overall chart aesthetics.
- Diamond1_Color and Diamond2_Color: These parameters allow traders to set distinct colors for two different types of diamond patterns (Diamond 1 and Diamond 2). By assigning unique colors to each pattern, traders can easily distinguish between them on the chart.
- Predicted1_Point_Color and Predicted2_Point_Color: These parameters define the colors for the predicted points (P) and the lines associated with these points for both Diamond 1 and Diamond 2 patterns. These points are likely calculated based on Gann’s ABC points and can offer insights into potential reversal levels.
- Show_Verticals: Enabling or disabling this option controls the visibility of vertical lines drawn from the predicted points (P). These lines serve as visual cues for potential market reversal points based on the Gann theory and the identified diamond patterns.
- History_Bars: This parameter allows traders to specify the number of historical bars used for analyzing and detecting diamond Gann waves. Adjusting this parameter can impact the accuracy and responsiveness of the indicator to recent market movements.
Diamond Gann Waves: The concept of diamond Gann waves suggests that these patterns hold predictive power regarding potential market reversals. The ABC points of the pattern likely play a crucial role in identifying and confirming the pattern. The predicted points (P) drawn by the indicator are likely intended to guide traders toward potential reversal levels based on Gann’s theory.
Important Notes:
- While the indicator offers predictive insights, it’s important for traders to combine this information with other technical and fundamental analysis tools to make well-informed trading decisions.
- Proper risk management should be practiced alongside the use of any indicator or trading strategy.
- Traders should consider backtesting the indicator on historical data and practicing with a demo account before using it in live trading.
Please note that my knowledge is based on information available up until September 2021, and I do not have access to real-time updates or specific developments that might have occurred after that date. If the indicator you’ve described has emerged or evolved since then, I recommend consulting the most recent sources or materials for the most accurate and up-to-date information.


Reviews
There are no reviews yet.