

Introduction: Oil Between Technical and Digital Analysis
Crude oil (USOUSD) remains a key asset in global markets, influenced by a mix of supply-demand factors, macroeconomic indicators, and technical analysis. Digital price models provide deeper insights into market trends and potential price movements.
Today’s analysis will cover:
✅ Key support and resistance levels for crude oil.
✅ The impact of economic events on oil prices.
✅ Technical indicators shaping market trends.
✅ Potential trading scenarios based on current conditions.
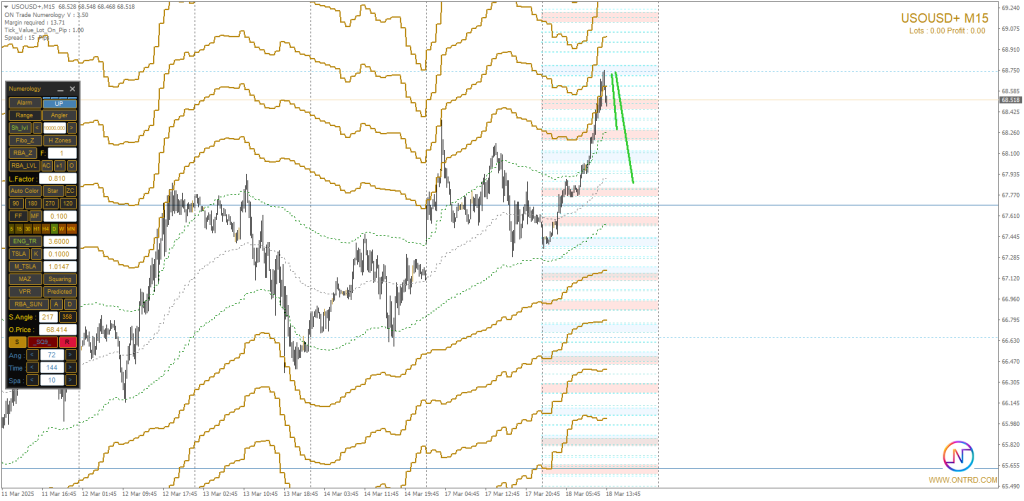
Key Support & Resistance Levels for Crude Oil
Oil is currently trading at $68.518, testing a key resistance zone. A breakout or rejection at this level could determine the next major move.
Support Levels:
| Level | Price (USD) |
|---|---|
| S1 | 67.770 |
| S2 | 66.630 |
| S3 | 65.490 |
Resistance Levels:
| Level | Price (USD) |
|---|---|
| R1 | 68.910 |
| R2 | 69.240 |
Economic News and Its Impact on Oil Prices
Several key macroeconomic reports released today could influence crude oil demand and price movements.
1️⃣ US Industrial & Housing Data
- Industrial Production MoM: 0.5% (expected 0.2%) – stronger than expected, indicating economic growth.
- Housing Starts MoM: -9.8% (expected -1.9%) – a significant decline, suggesting a slowdown in real estate.
- Building Permits: 1.473M (expected 1.45M) – slight increase, showing stable future construction activity.
Impact on Oil:
- Strong industrial production supports demand for energy, potentially bullish for oil.
- Weak housing starts could indicate slowing economic growth, reducing oil consumption in the long run.
2️⃣ API Crude Oil Stock Report
- Crude Oil Stock Change: 4.247M (expected 1.17M) – a higher-than-expected build in inventory.
Impact on Oil:
- A larger inventory build suggests lower demand, which could trigger a short-term bearish move.
- However, if oil demand rebounds, prices may stabilize.
Technical Indicators to Watch for Oil
- RSI: Currently at overbought levels, indicating a possible correction.
- Bollinger Bands: Price is near the upper band, suggesting a potential retracement.
- 50-Day Moving Average: Positioned around $67.500, acting as an important support level.
Potential Oil Trading Scenarios for Today
🔼 Bullish Scenario: Breakout Towards $69.240+
If crude oil sustains momentum above $68.910, a breakout could push prices toward $69.240.
📌 Key Conditions for This Scenario:
✅ Price holds above $68.910.
✅ Demand increases due to strong industrial production.
✅ Market sentiment remains bullish.
🎯 Target Levels:
- First Target: $69.240
- Extended Target: $70.000+
Supporting Factors:
- Positive economic growth data supporting oil demand.
- Strong technical momentum if price remains above key resistance.
🔽 Bearish Scenario: Pullback Towards $66.630
If oil fails to break $68.910, a rejection could lead to a pullback toward $67.770 – $66.630.
📌 Key Conditions for This Scenario:
✅ Price struggles to stay above $68.910.
✅ Higher-than-expected oil inventories increase selling pressure.
✅ Weak housing market data raises economic concerns.
🎯 Target Levels:
- First Target: $67.770
- Extended Target: $66.630
Supporting Factors:
- Overbought RSI indicating a correction.
- Large crude oil stock build suggesting weaker demand.
- Potential risk-off sentiment in global markets.
Crude Oil Pivot Points for March 18, 2025
| Level | Price (USD) |
|---|---|
| Pivot Point | 68.500 |
| Bullish Breakout Above | 68.910 |
| Bearish Breakdown Below | 67.770 |
The pivot point at $68.500 will be crucial in determining the short-term trend. A move above favors bullish momentum, while a drop below it could trigger further downside pressure.
Final Thoughts: What’s Next for Oil?
Crude oil prices are at a key decision point, influenced by economic data, technical trends, and market sentiment.
📌 Key Takeaways for Traders:
✅ Watch $68.500 pivot level for directional confirmation.
✅ Monitor crude oil inventory reports for supply-demand signals.
✅ Align trading strategies with macro and technical trends to optimize risk management.
Oil’s price action will depend on whether it sustains bullish momentum or faces resistance at key levels. Traders should stay flexible and adjust strategies based on market developments.
📢 Stay updated for further insights Contact US.
🔗 Check Also:
