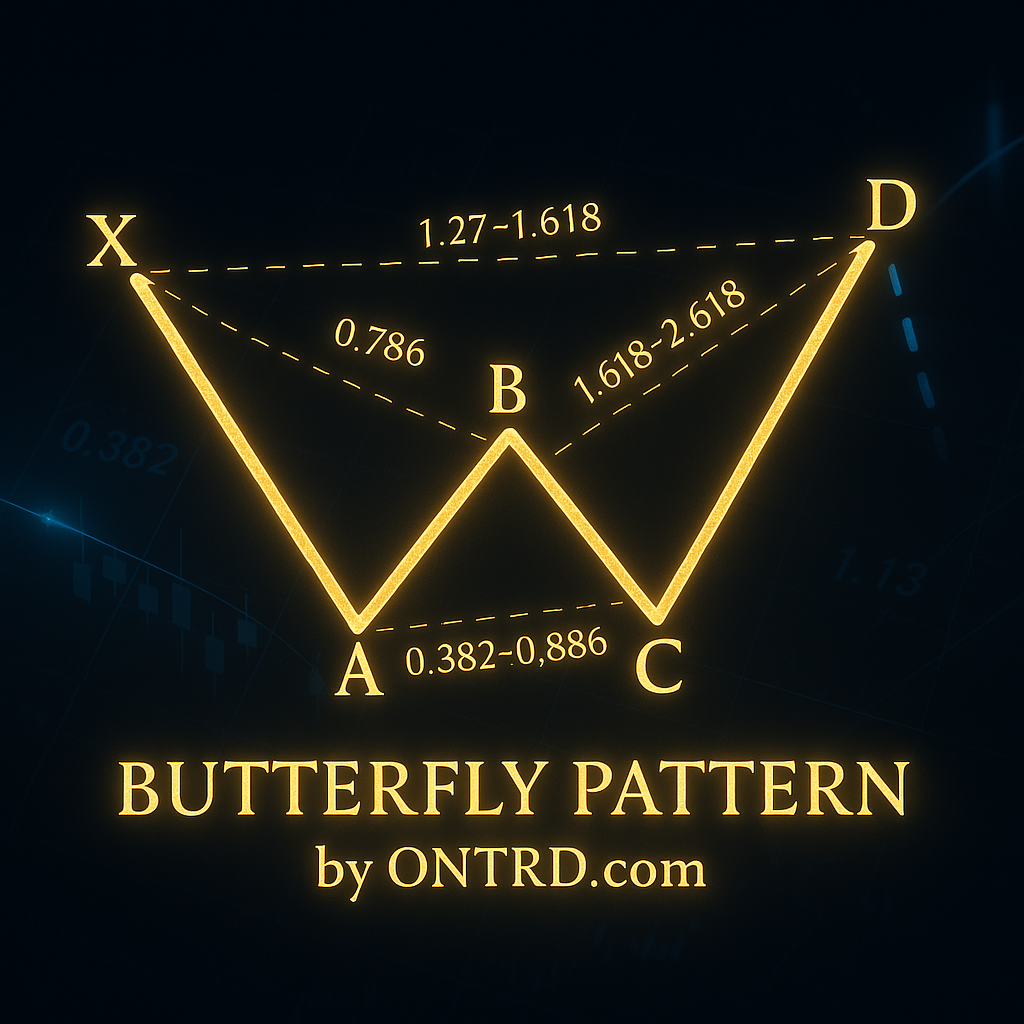
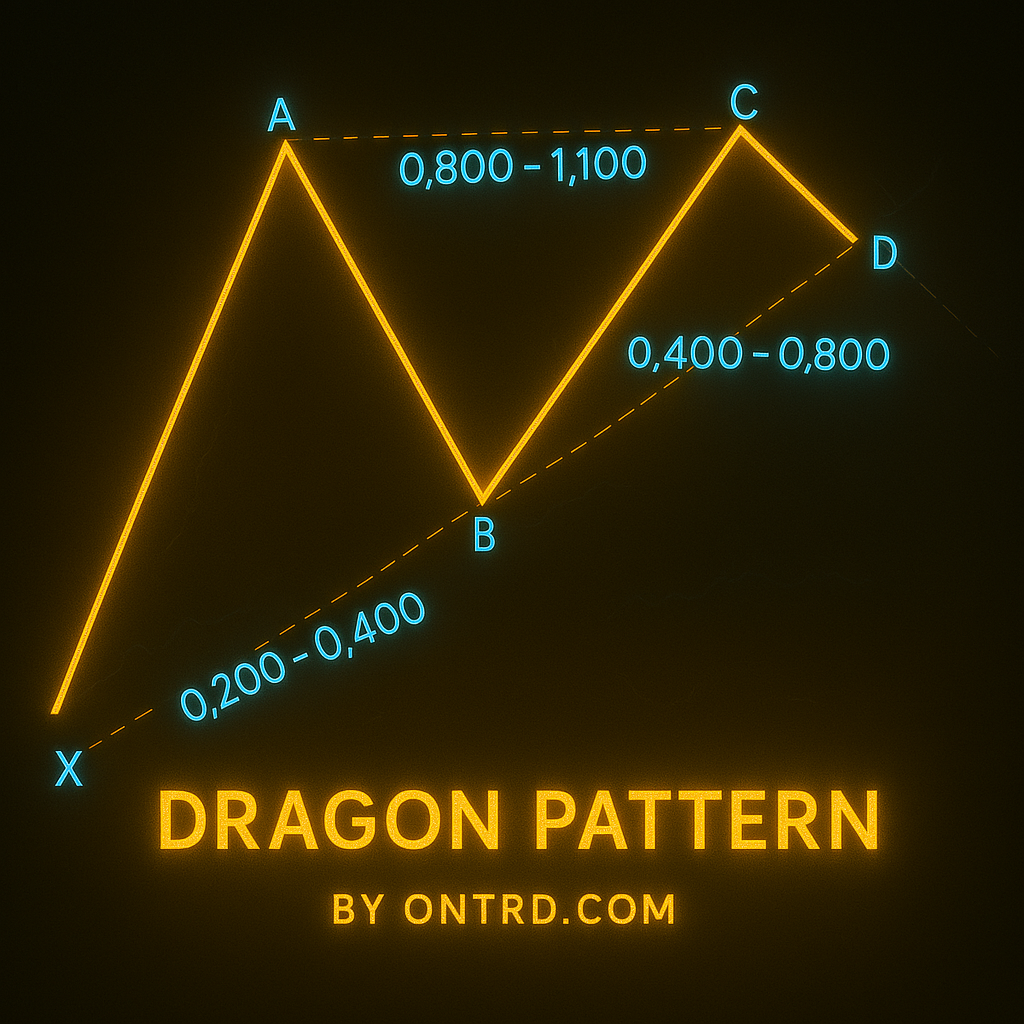
The Butterfly harmonic pattern is one of the most reliable reversal patterns in technical analysis. Developed by Bryce Gilmore and later refined by Scott Carney, this pattern helps traders identify potential market turning points with exceptional accuracy.
🔑 Key Features:
✔ Distinctive M or W shape on price charts
✔ Precise Fibonacci ratios for high-probability entries
✔ Works across all markets and timeframes
✔ Provides clear stop loss and take profit levels
1. Origins of the Butterfly Harmonic Pattern
- Initial Development: Bryce Gilmore (1990s)
- Refinement: Scott Carney (early 2000s)
- Name Origin: The pattern resembles butterfly wings when complete
- Key Improvement: Added stricter Fibonacci requirements to original Gartley pattern
2. Butterfly Harmonic Pattern Structure & Fibonacci Ratios
Pattern Points (X-A-B-C-D)
| Leg | Fibonacci Requirement |
|---|---|
| AB | 78.6% of XA |
| BC | 38.2% – 88.6% of AB |
| CD | 161.8% – 261.8% of BC (Must reach 127.2% or 161.8% of XA) |
Bullish vs. Bearish Butterfly
- Bullish Butterfly: Forms at market bottoms (Buy at D)
- Bearish Butterfly: Forms at market tops (Sell at D)
3. How to Trade the Butterfly Harmonic Pattern (Step-by-Step)
Step 1: Identify XA Impulse Move
- Look for strong directional price movement
Step 2: AB Retracement (Critical 78.6%)
- Must retrace exactly 78.6% of XA (key difference from other harmonic patterns)
Step 3: BC Retracement (38.2% – 88.6%)
- Should stay within Fibonacci range
Step 4: CD Extension (Most Important)
- 161.8% – 261.8% of BC
- Must reach 127.2% or 161.8% of XA
Step 5: Enter at Point D
- Buy (Bullish Butterfly) or Sell (Bearish Butterfly) with confirmation
4. Stop Loss & Take Profit Rules
Stop Loss Placement
- Bullish Butterfly: Below point D
- Bearish Butterfly: Above point D
Take Profit Targets
| Target | Fibonacci Level |
|---|---|
| TP1 | 38.2% of AD |
| TP2 | 61.8% of AD |
| TP3 | 100% of AD |
5. Confirmation Signals (Increase Accuracy)
✔ Price Action: Reversal candles (pin bars, engulfing patterns) at point D
✔ RSI/MACD Divergence
✔ Volume Analysis: Increased volume at reversal point
✔ Trendline/Support-Resistance Confluence
6. Butterfly vs. Gartley Pattern
| Feature | Butterfly Pattern | Gartley Pattern |
|---|---|---|
| AB Leg | 78.6% of XA | 61.8% of XA |
| CD Leg | 127.2-161.8% XA | 78.6% XA |
| Accuracy | Higher | Moderate |
| Frequency | Less common | More common |
7. Frequently Asked Questions (FAQs)
Q1: Why is the 78.6% AB retracement so important?
A: This exact retracement distinguishes the Butterfly from other patterns and increases reversal probability.
Q2: Best markets for Butterfly pattern?
A: Works well in Forex (major pairs), stocks (liquid equities), and crypto (BTC, ETH).
Q3: How to avoid false Butterfly signals?
A: Always wait for price confirmation at D point and check for RSI divergence.
Q4: Butterfly vs. Bat pattern – which is better?
A: Butterfly offers stronger reversals but appears less frequently than Bat patterns.
8. Professional Trading Tips
- Be patient – True Butterfly patterns are rare but high-quality
- Combine with trend analysis – Works best when aligned with higher timeframe trend
- Use partial profits – Take 50% at TP1, move stop to breakeven
- Practice on historical charts before trading live
9. Conclusion
The Butterfly harmonic pattern is a powerful tool for spotting high-probability market reversals. Key takeaways:
✅ 78.6% AB retracement is mandatory
✅ CD must extend to 127.2%-161.8% of XA
✅ Always use confirmation signals
✅ Works across all timeframes and markets
✅ Be careful at Economic News Times .
🚀 For best results, combine Butterfly patterns with other technical analysis tools for confluence.
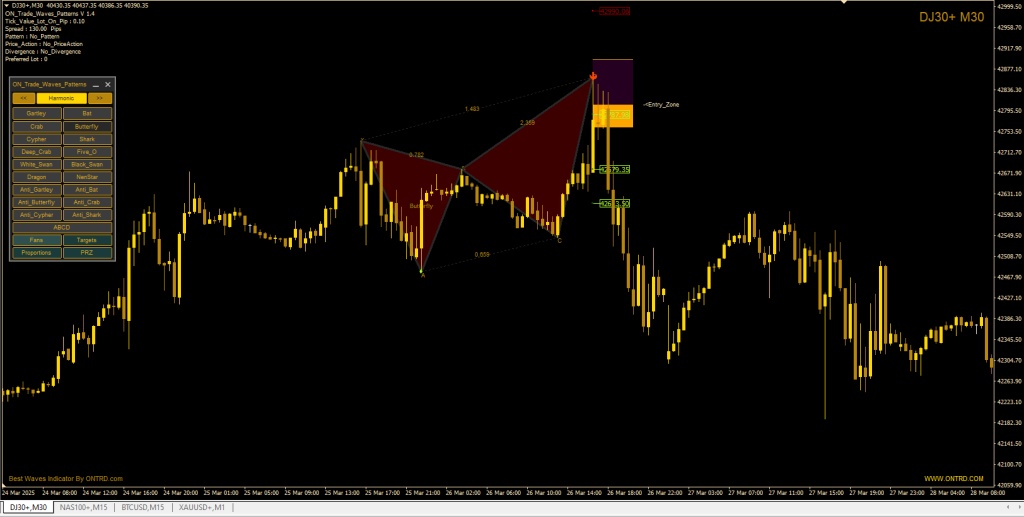
- Best Product To Detect Harmonic Patterns is ON Trade Waves Patterns
Example :
