

Beyond classic technical analysis lies a powerful set of geometric tools developed from the theories of W.D. Gann. Among them, the Gann SQ9 Styles Star, Crystal, and Fan patterns stand out as advanced techniques that project market direction, time zones, and hidden reversal areas. In this article, we explore how these structures work and how you can apply them to gain deeper insight into price movements.
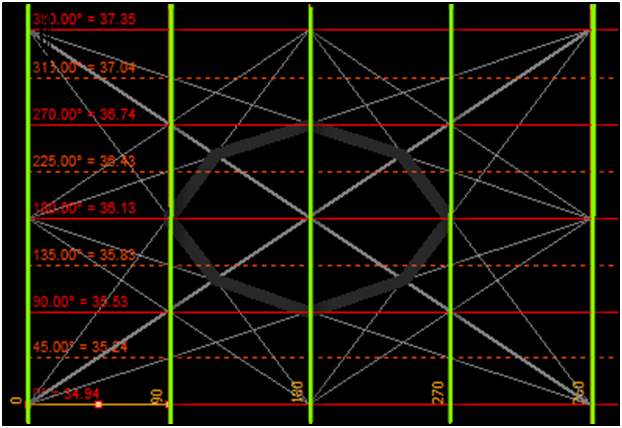
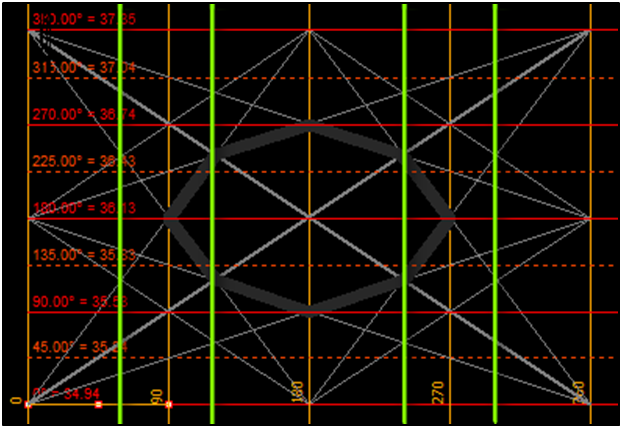
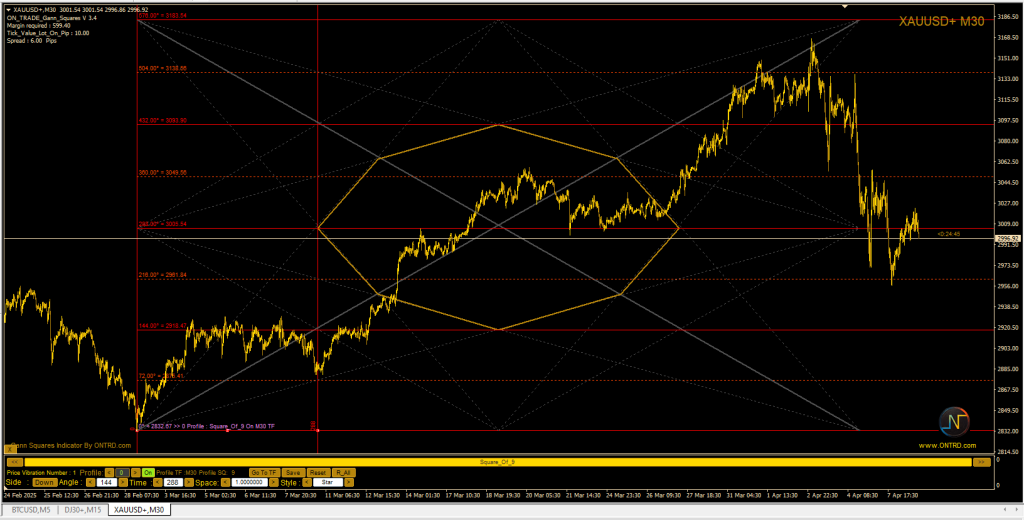
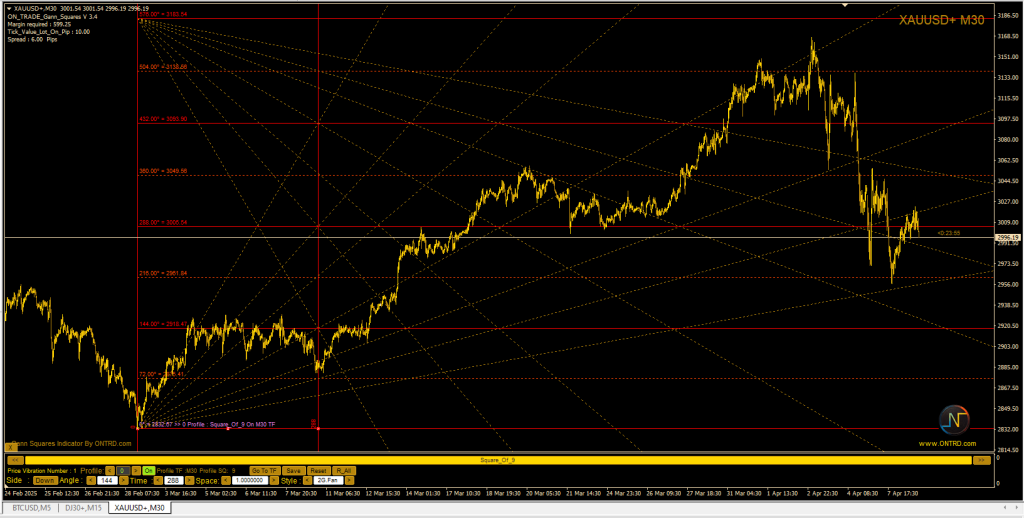
It’s a case of representing the nine squares also on the chart, like channels. Its default state comes, It comes with an angle of 90 or denominators and its time – multiplication.
They can be used in quadruple, circular, straight and circular forms. We adjust the time so that we contain the price as much of its movement as possible.
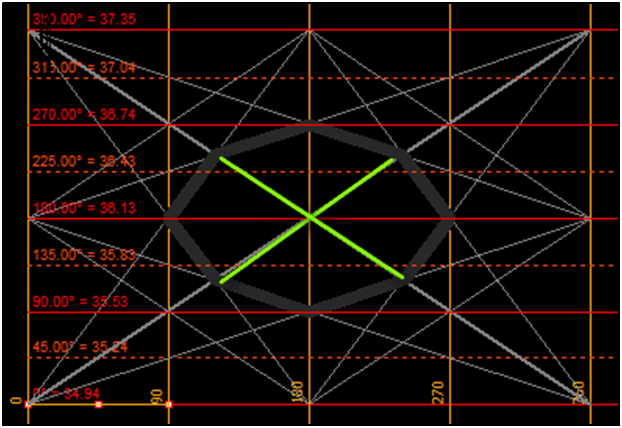
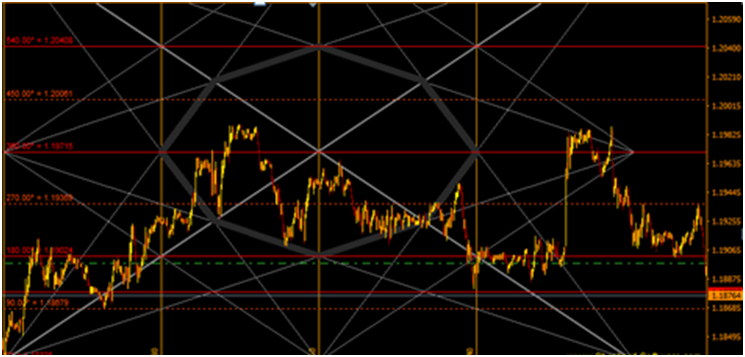
The most important thing about it is the two latitude diameters of the green crystal in the picture.
The star has several intervals
First are basic time slots:
Second, hidden time breaks::
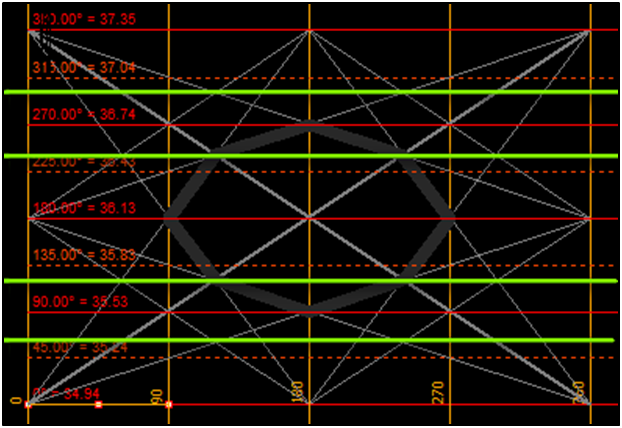
Of course the word interval means that when the price goes up and goes through the interval, it’s going to go down even a little bit at the break that’s just before or after it. That is, the trend changes in whole or in part as the price goes by the interval.
The star also has the advantage of having supports and resistors, Besides the main and secondary angels… As in the picture..above
From its features, it draws the crystal where the most difficult phase of the price is when it enters the crystal and when it comes out, it determines the direction of the price when it comes out, It’s distinctive in gray in pictures
.
One of the features of the star is that the price is hard to go up or down three levels, and it has to reflect after level three
.
Conditions for the validity of the star drawing:
The price contains that is, the price must not go above its upper limits or below its lower limits.
- Price respects the crystal in his movement
- Qualitatively respectful of time breaks
But what does it mean to disconnect from the star…
Decoding, It’s the case the price goes out of bounds of the right star…
In other words, the sketch of the star is two sides, we studied the movement of the price in the first half of the star, And we’re going to study the perfection of the price movement, so when you get out of the crystal, the price goes in the triangles of the movement of any exit that we call decoding. It has its own rules.
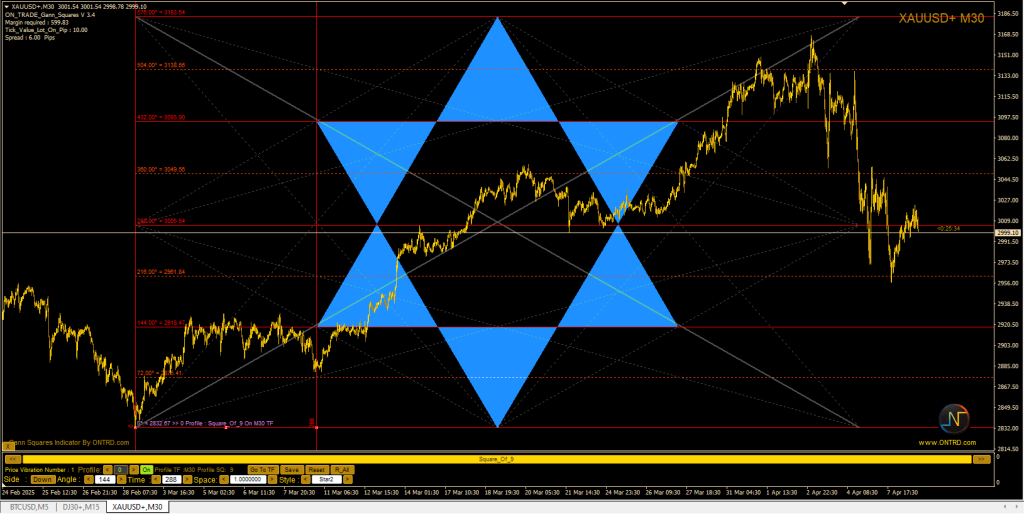
🌟 The Gann Star: Mapping Time with Precision SQ9 Styles
The Gann Star is a dynamic grid of time intervals laid out in a star pattern. It divides the price chart into geometric shapes defined by angles and intervals.
Key Features:
- Composed of basic and hidden time intervals
- Defines support/resistance levels
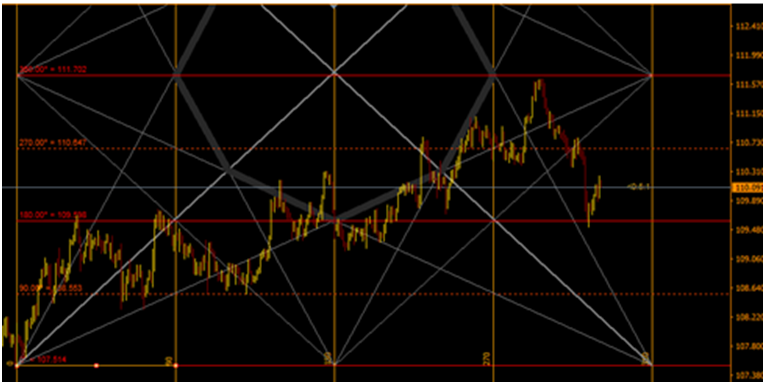
- Central area known as “the Crystal” is a zone of maximum price friction
How to Use It:
- Plot the Star with default angle 90° (or its multiples).
- Watch how price reacts at time breakpoints.
- Strong reactions occur when price intersects the head or base of triangles within the Star.
Critical Concept: When price exits the star’s boundary—especially from triangle tips—it often signals a 90% probability of reversal toward the star’s center.
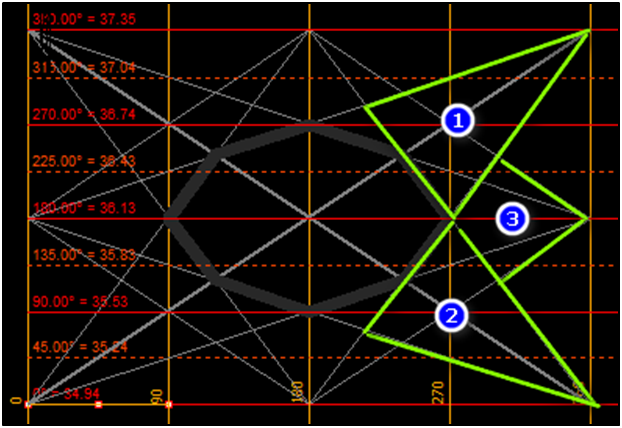
- If the price gets out of triangle number 1, the price tests the nearest angle and then goes back down and the effect ends with the star’s time.
- If the price comes out of triangle 2,The price will test the nearest angle and go up and the effect ends with the star’s time.
- If the price comes out of the triangle, a number tests the nearest angle opposite its direction،Then he completes the direction he came from and the effect ends with the star’s time.
Ideal and systemic decoding in the star occurs at the heads of triangles1&2,The top or bottom of the star. If the price comes out of the head of the triangle number from the top, the probability of the price falling is about 90 percent, and the drop is done with the mid-star goal. If the price exits the head of the triangle below the star, the probability is that the price will climb 90% towards the middle of the star.
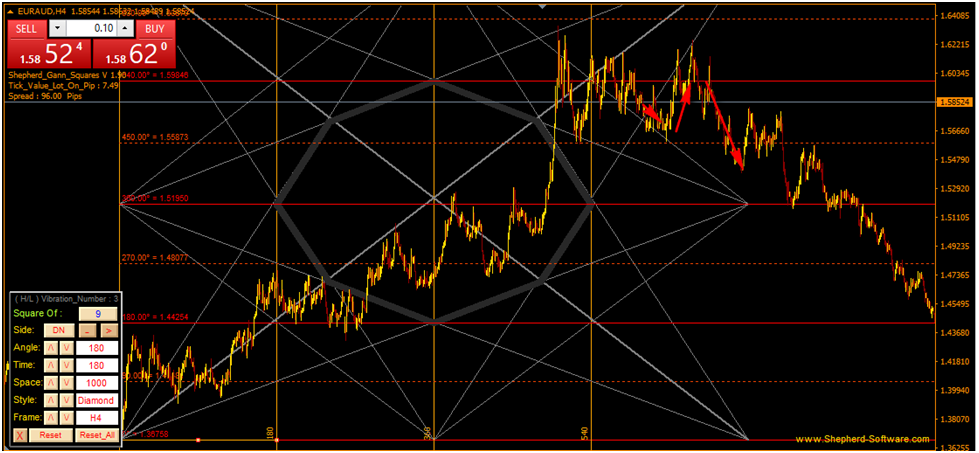
💎 The Crystal: High-Pressure Zone of Decision
The Crystal is the core of the Star where time and price are most compressed. Price movement within this zone tends to:
- Slow down
- Consolidate
- Prepare for a breakout or breakdown
Rules of Interpretation:
- If price exits from the top triangle, expect a fall toward the crystal’s midline.
- If price exits from the bottom triangle, expect a rally to the midline.
- Reactions occur most often at three levels—price rarely crosses them all without correction.
Pro Tip: The Crystal is best used to anticipate breakout zones and set tight entry triggers.
🌀 Gann Fans: Angular Support and Resistance
The Gann Fan is a system of angled lines radiating from a starting point, designed to forecast:
- Future support/resistance levels
- Momentum of trend
- Reversal timing
There are two main types:
- Single Fans: Based only on the start point (price + time).
- Double Fans: Connect both the start and a significant future angle (e.g., 360° intersection).
How to Apply:
- Start from a major top or bottom.
- Plot fan angles like 1×1, 2×1, 1×2.
- Monitor how price reacts as it touches each angle.
Strategy Tip: A break below a fan line often signals price acceleration toward the next fan.
🔁 Combining These Tools for Deeper Insights
When you layer the Star, Crystal, and Fan tools:
- You create a network of confluence zones
- Price behavior becomes less random and more predictable
- Trade entries align with geometric validation points
This creates a multi-dimensional framework that captures not just “where” price might go, but “when” and “how.”
🎯 Example Scenario
- Start with a recent bottom and plot the Star.
- Identify if price is inside or exiting a triangle zone.
- Layer the Fan lines from the same point—watch for convergence.
- If price hits an angle and a star boundary, this is a high-probability signal for a reversal or acceleration.
🔚 Conclusion
Mastering Gann’s Star, Crystal, and Fans gives traders access to a sophisticated timing system. These tools are more than visual aids—they’re geometry in motion, capable of revealing the market’s underlying rhythm.
When used properly, they turn your chart into a time map, guiding your decisions with clarity and confidence. Whether you’re trading currencies, indices, or commodities, these tools help you synchronize with the market’s internal clock.
The Best and only product to draw SQ9 Styles is ON Trade Gann Squares indicator .


