


Among the many tools in the Gann arsenal, one stands out for its reliability and predictive power—the Gann 144 Levels. These predefined price zones help traders identify critical support/resistance areas, anticipate price reversals, and confirm trade setups. In this article, we explore the theory behind these levels, how they are constructed, and how to apply them in real trading.
🔢 What Are Gann 144 Levels?
The 144 Levels are a series of pre-calculated price markers that act as magnetic points on the chart. They are not random—they are rooted in numerical cycles and harmonic principles.
Each block of 144 points represents a range of price action. When one level is broken, price is statistically likely to travel to the next. These levels act as attractors and reflectors—pulling price toward them or pushing it away.
🧮 How Are They Calculated?
The construction of these levels follows a layered numerical table:
- First block: Starts at 0, moves up to 144 in consistent steps
- Second block: From 144 to 288
- Third block: From 288 to 432
- … and so on into infinity
These levels are based on multiples of 144, and each table can be broken into quarters. Price reactions often occur at every ¼ point within the table, making them predictable reaction zones.
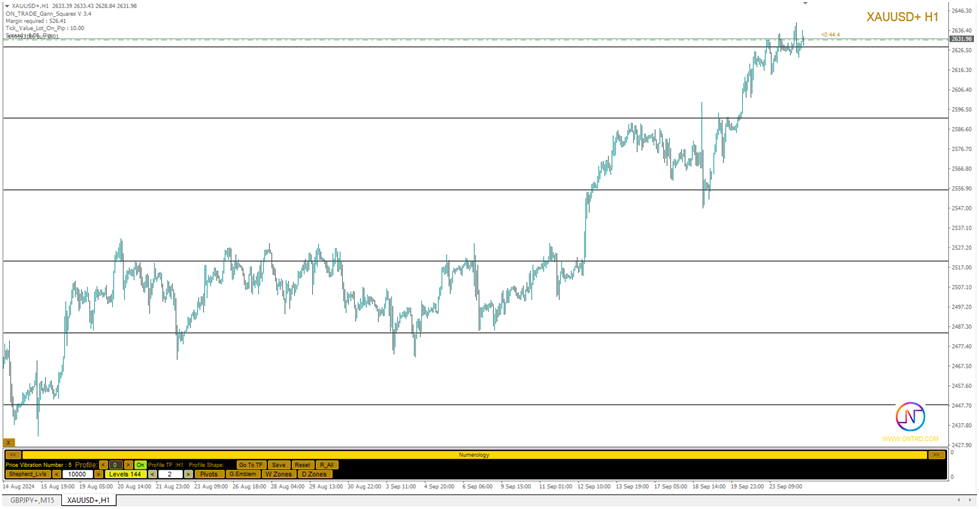
Originally calculated manually using Excel or Gannalyst software, the process is now automated using the ON Trade Gann Squares indicator.
🎯 Why Are 144 Levels So Effective?
Unlike basic support/resistance drawn from historical highs or lows, the 144 Levels:
- Are predefined, reducing subjectivity
- Are respected by price, even across timeframes
- Create natural zones of price congestion
- Guide entry, exit, and stop placement
Traders rely on these levels for anticipating breakouts, identifying retracement zones, and confirming price exhaustion.
💡 How to Use 144 Levels in Real Trading
Scenario 1: Price Breaks a Level
If price breaks through a 144 level with strength (especially with two full candle closes):
- Expect a move to the next level
- Set your take-profit target at that level
- Use the broken level as your stop-loss pivot
Scenario 2: Price Reverses at a Level
If price touches but doesn’t break a 144 level:
- Watch for candlestick confirmation (like pin bars or engulfing patterns)
- Use the zone for a reversal trade with a tight stop
Scenario 3: Confluence with Other Gann Tools
The 144 levels are most powerful when they intersect with time zones, fan lines, or price clusters. These confluences represent high-probability reversal zones.
🔁 Adjusting Density with Space Setting
The ON Trade Gann Squares indicator lets you control the spacing (density) of levels:
- Tighter spacing for scalping or lower timeframes
- Wider spacing for swing trading or daily charts
This feature helps tailor the indicator to your trading style without compromising the core logic.
📊 Example
Let’s say a market bottom is at 144. The next significant level is 288. If price breaks 144, the path to 288 becomes your roadmap.
If price starts to hesitate at 216 (a mid-point), it may be a temporary retracement zone—great for partial exits or reentries.
🔚 Conclusion
The 144 Levels are more than a technical overlay—they’re a mathematical map of market structure. Whether you’re day trading or swing trading, these levels give you an objective framework to navigate price action. When paired with other Gann elements like time channels, fans, and price clusters, the 144 Levels become a core part of a multi-dimensional trading system.
By understanding how to plot, interpret, and trade with them, you gain access to high-probability zones that many traders never see.
Best product to draw 144 Levels is ON Trade Gann Squares


