


One of the most powerful—yet often overlooked—concepts in market geometry is the Price Cluster. In Gann analysis, a price cluster represents a zone of confluence where multiple technical elements align. These intersections act like magnets, attracting price and often triggering major market reactions.
This article dives deep into the theory and application of price clusters, explaining how to identify them, how they work, and how they can significantly increase your accuracy as a trader.
🧠 What is a Price Clusters?
A Price Cluster is a point or narrow zone on a chart where:
- Several Gann levels intersect
- Multiple indicators or chart patterns converge
- Time and price align geometrically
In Gann theory, clusters are seen as energy zones—areas where market decisions are most likely to be made. They represent a build-up of market consensus.
Think of it this way: when several technical signals agree at a specific price range, that area becomes highly significant. Price may:
- Pause (consolidate)
- Reverse (trend change)
- Explode (breakout zone)
🔁 The Components That Form Price Clusters
Clusters can be formed by combining:
- Gann Levels (e.g., 144, 90)
- Gann Angles (1×1, 2×1)
- Time Price Channels
- Fibonacci Extensions or Retracements
- Support/Resistance Zones
- Moving Averages
- Harmonic Patterns
- Volume Profile or Order Blocks
The more of these elements that intersect, the stronger the cluster becomes.
Where Clusters Occur
There are two main contexts where clusters form:
1. Multi-Timeframe Confluence
When a level from the higher timeframe (e.g., daily or weekly) aligns with levels on the lower timeframe (e.g., 1H or 15M), that shared price zone becomes a cluster.
Example:
- A 144 Gann level from the daily chart aligns with a harmonic completion point on the 1H chart.
- Add a volume peak at that price → explosive reaction expected.
2. Indicator Convergence
When several indicators (MA, Gann Fan, trendline, Fibonacci) point to the same price area, it creates an intra-frame cluster—within the same chart window.
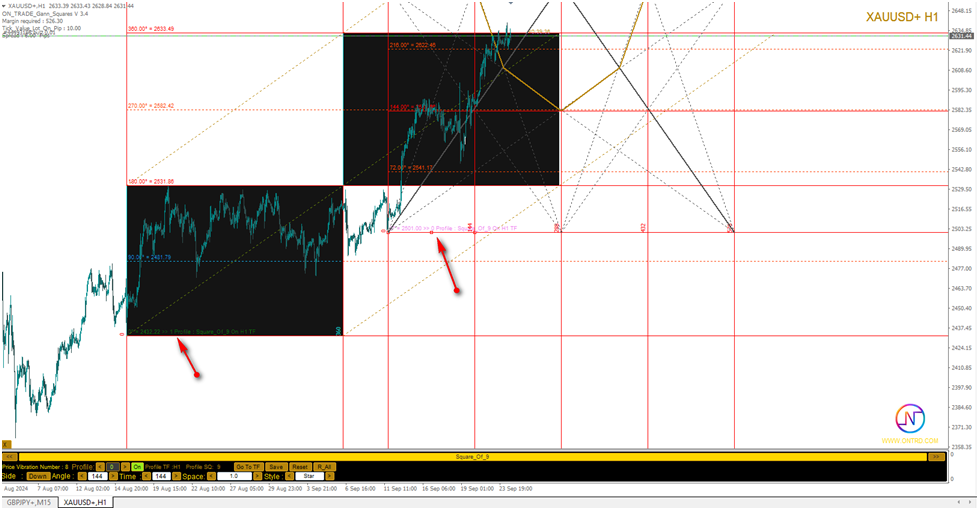
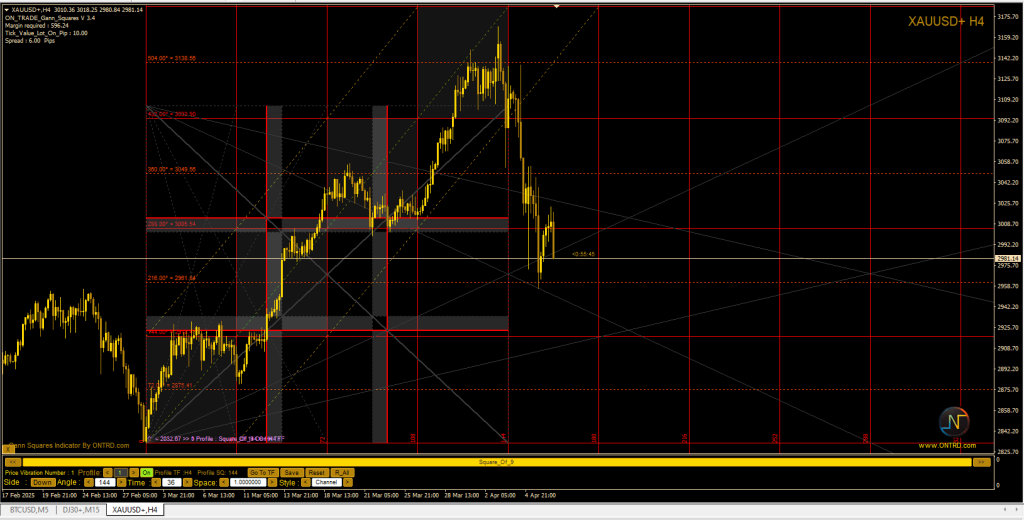
🧮 How to Identify Clusters with the Gann Squares Indicator
Using the ON Trade Gann Squares Indicator, you can:
- Plot multiple Gann levels
- Overlay harmonic zones
- Draw fan angles and time-price grids
- Save custom profiles to analyze cluster zones dynamically
The indicator allows you to visually track confluence by projecting:
- Time extensions
- Price symmetry zones
- Historical cycle repeats
When you see these layers crossing, you’re looking at a price cluster.
🎯 Why Clusters Work
Price clusters compress uncertainty. Instead of relying on one method or level, you stack several—each reinforcing the others. This offers:
- Increased precision: You know exactly where to watch.
- Tighter stops: Entries become cleaner and better timed.
- Higher reward-to-risk ratios: Targets are more realistic.
Clustering is also psychological—many traders, knowingly or unknowingly, act at these intersections, creating self-fulfilling outcomes.
🧪 Trading Strategy: Cluster Reaction Entry
Here’s a simple strategy to trade clusters:
1. Identify a Valid Cluster
- Look for at least 3 technical overlaps (e.g., 144 Gann level + time fan + Fibonacci).
2. Wait for Price to Touch the Cluster
- Don’t front-run. Wait for the market to “see” the cluster.
3. Look for Confirmation
- Candlestick reversal (pin bar, engulfing)
- Volume spike
- RSI divergence
4. Enter Trade with Defined Stop
- Place stop slightly outside the cluster range.
- Target the next major Gann level or opposite side of the range.
Pro Tip: If the price blows through the cluster without hesitation, wait for a retest—this often becomes a breakout trade instead.
📊 Real Example Scenario
Imagine EUR/USD approaching the 1.0840 area:
- 144 Gann level from daily timeframe
- 1×1 Gann Fan from a previous low
- Fibonacci 61.8% from a prior swing
Price hits that level, forms a bearish engulfing candle on the 1H chart, and RSI shows divergence.
→ This is a textbook cluster reversal trade.
🔄 Price Clusters vs. Price Zones
It’s important to differentiate between:
- Support/Resistance Zones: General areas
- Price Clusters: Highly calculated, layered precision zones
Clusters are scientific, not just based on chart memory. They offer objective evidence for market behavior.
⚙️ Tools to Improve Cluster Detection
- ON Trade Gann Squares (automatic projection of levels and fans)
- Fibonacci Extension tools
- Harmonic Pattern Scanner
- Volume Profile overlay
- Multi-timeframe grid plotting
Use these together to create your own cluster dashboards.
🔚 Conclusion
Price Clusters are goldmines for traders. When multiple technical signals converge on the same price area, they mark zones of high interest, high volatility, and high opportunity.
Whether you’re a scalper or a swing trader, mastering the art of clustering will elevate your ability to:
- Time entries
- Avoid false signals
- Exploit market turning points
When combined with Gann’s time analysis and price angles, price clusters become a supercharged strategy that delivers accuracy, structure, and control to your trading decisions.
Have The ON Trade Gann Squares Now .


