


Markets aren’t chaotic. They move in patterns, cycles, and geometry—at least, that’s the foundation of Gann analysis. In this guide, we explore the concept of Time Price Channels, a powerful tool derived from Gann’s Nine Square theory, which combines price movement with temporal progression. This article explains how to draw these channels, interpret them, and use them to anticipate future price behavior.
📐 What Are Time Price Channels?
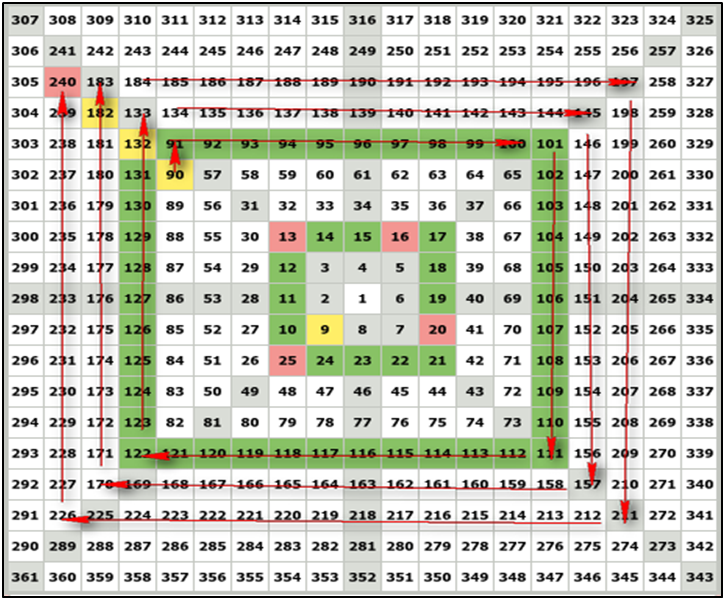
Time Price Channels (TPCs) are geometric zones drawn on a price chart, where time and price intervals intersect. Think of them as dynamic tunnels guiding the market through specific paths.
They are built by:
- Identifying a valid top or bottom (starting point).
- Projecting price levels (based on Gann angles like 90°, 180°, etc.).
- Plotting vertical time intervals that align with those angles (e.g., every 90 candles).
- Connecting the intersections to form channel walls.
This creates a predictive structure that shows how far and when a price might travel.
🎯 Finding the Right Starting Point
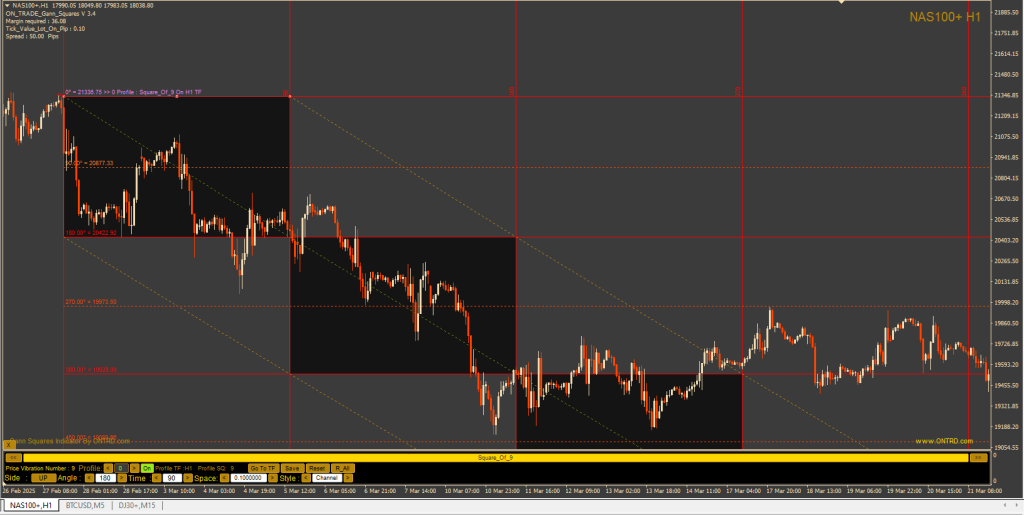
Choosing the correct top or bottom is critical for accuracy. Here’s how to verify:
- It should be the highest high or lowest low over the last full time cycle (usually 360 candles).
- Look for a clear reversal pattern and a retracement of 40–75%—this confirms it as a valid pivot.
- If the first drawn angles don’t align with price action, try adjusting slightly to the next valid reaction point.
This is the launchpad for your Time Price Channel.
🧮 Price Movement Within the Channel
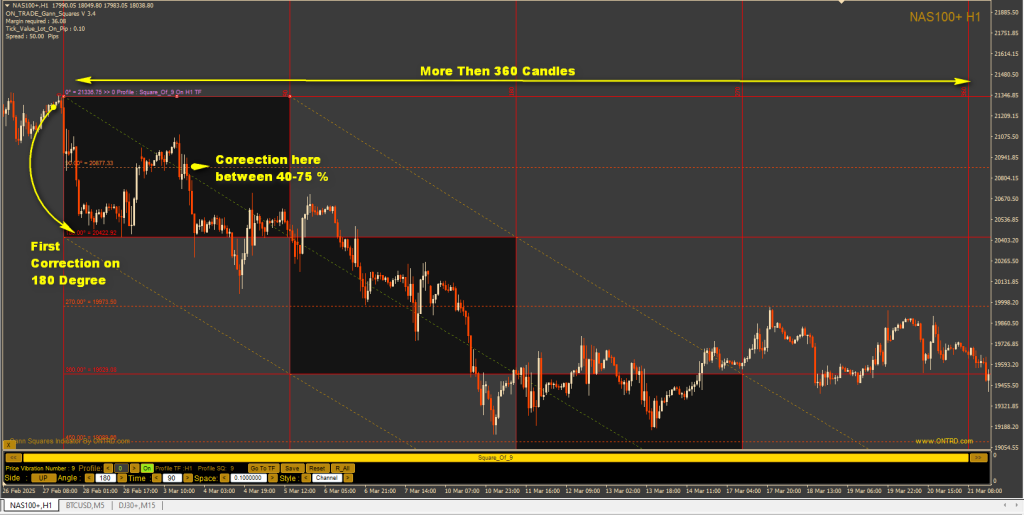
Once the channel is drawn, price tends to respect its upper and lower bounds, forming a repeating pattern of:
- Bounce → Breakout → Reversal
Here’s how to interpret the price action:
- The upper and lower limits act like support/resistance lines.
- Midpoints and quarter points (like 1/2 or 1/4 the angle) are hidden reaction zones—price often pauses or reverses temporarily.
- A break of the channel (confirmed with two full candle closes outside) signals a major shift in trend.
⏱ Time Intervals Are Key
Most traders focus only on price—but time is half the equation. Gann emphasized that timing matters just as much as price levels.
You can add vertical lines to your chart based on:
- Full angle values (e.g., every 90 candles if using 90°)
- Subdivisions (e.g., 45 or 180 candles)
When price and time meet—particularly at strong Gann angles—it often causes a reaction or reversal.
🧠 Practical Examples
- If price hits the 360° price level at the 180th candle, expect a reversal or at least a pause.
- If price reaches a target early, it may range sideways until the time catches up.
- If time arrives before price, expect a sharp reaction toward the nearest valid angle.
One particularly strong area is the “killer point”—where price and time intersect at a major angle like 180° or 360°. Expect up to 95% reversal probability here.
⚠️ What If Price Breaks the Channel?
- Early Arrival: Price reaches the target angle before the time cycle completes. Expect sideways consolidation or shallow correction.
- Late Arrival: Time cycle completes but price hasn’t reached target. Watch for channel breakouts or unexpected reversals.
In either case, candle confirmation (two full closes outside the channel) is essential.
🔚 Conclusion
Gann’s Time Price Channels are a revolutionary way to align geometry with market movement. By combining time intervals with angular price targets, traders can forecast market behavior with stunning precision. Whether you’re swing trading or day trading, mastering this method helps reduce noise and improve timing dramatically.
If used in conjunction with other Gann tools like Gann Fans, Squares of 144, and Harmonic Patterns, these channels become a core strategy for high-level forecasting.
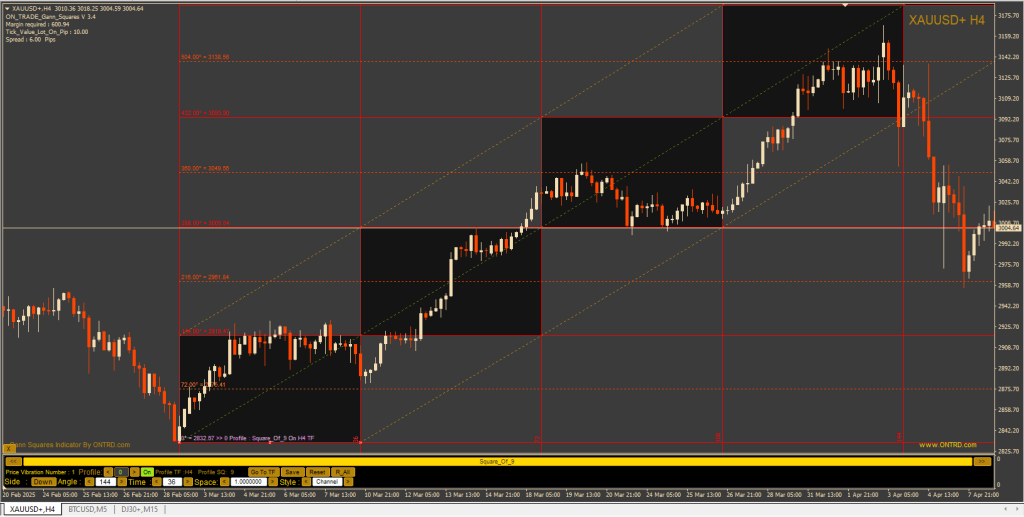
The Best Product and only one to draw this Channels on Chart is ON Trade Gann Squares indicator .


