


Gold Price Overview – M15 Timeframe
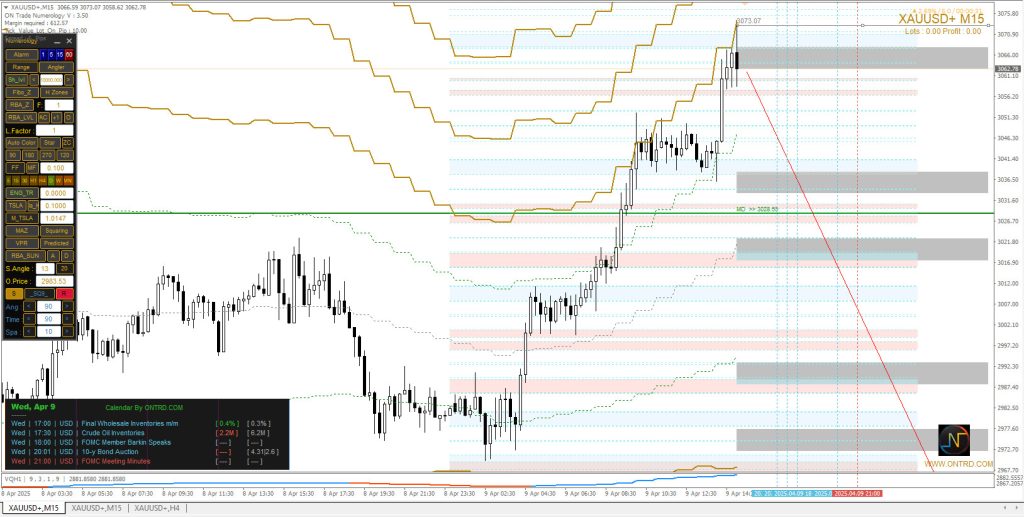
On the 15-minute chart, XAUUSD+ recorded a new intraday high at 3073.07 USD, currently trading near 3065.65 USD. The rally was strong during the early European session, driven by short-term momentum and bullish sentiment. However, the price is now showing early signs of weakness at the resistance zone, and a possible retracement is developing.
Key Technical Highlights
- Chart Type: M15 (15-minute)
- Indicator Tools: Numerology levels, ONTRD Predicted Zones, VWAP bands, Fibo Squaring Tools, Volume Profile Ranges (VPR)
- Observed High: 3073.07
- Observed Low: 3028.55 (MD Level)
The chart setup indicates a sharply defined resistance at the 3070+ region, combined with volume exhaustion and the appearance of sell pressure near peak highs.
Important Resistance Zones
| Resistance Level | Technical Description |
|---|---|
| 3073.07 USD | Intraday high; currently acting as a ceiling |
| 3065.65 USD | Immediate resistance after rejection |
| 3061.80 – 3063.00 USD | Cluster of predicted levels and VWAP boundaries |
These levels are likely to attract seller interest, especially if upcoming economic data favors the U.S. dollar.
Important Support Zones
| Support Level | Technical Description |
|---|---|
| 3028.55 USD | Mid-day pivot support (MD Level) |
| 3016.90 – 3018.00 USD | First expected reaction zone |
| 2983.50 USD | Deep technical support from the squaring model |
Support zones suggest that if the retracement unfolds, buyers may re-enter near these key areas.
Technical Indicators Analysis
- RSI (Relative Strength Index): Reading near 71, indicating overbought conditions and the possibility of reversal or cooling off.
- MACD: Shows divergence between price highs and momentum, a classic signal for correction.
- Volume Profile: Diminishing volume at recent highs, suggesting exhaustion and a potential bearish reversal.
Bearish Projection & Price Path
A red descending line is marked from 3073.07 suggesting a forecasted path if the selling continues. The projection includes:
- Short-term pullback to 3035.60 – 3030.00 range
- MD support retest at 3028.55 USD
- Further bearish leg toward 2983.50 USD in case of strong downward momentum
This scenario remains valid as long as price does not close firmly above 3073 on M15 or higher timeframes.
Fundamental Drivers – April 9, 2025
Economic news from the U.S. plays a major role in gold volatility. Here are the scheduled high-impact releases for today:
| Time (GMT) | Event | Forecast | Previous | Expected Impact |
|---|---|---|---|---|
| 17:00 | Final Wholesale Inventories (m/m) | 0.4% | 0.3% | 🟢 Moderate |
| 17:30 | Crude Oil Inventories | -2.2M | -6.2M | 🔴 High |
| 18:00 | FOMC Member Barkin Speaks | — | — | 🔴 High |
| 19:00 | 10-Year Bond Auction | — | 4.31% | 🟡 Moderate |
| 21:00 | FOMC Meeting Minutes | — | — | 🔴 High |
Impact Summary:
- FOMC Minutes: Expected to influence market sentiment around interest rates. Hawkish tone = dollar strength = gold weakness.
- Oil & Inventories: Indirectly affect inflationary expectations, influencing gold as a hedge.
- Barkin’s Speech: May provide hints on the Fed’s next moves; volatility is expected post-statement.
Scenarios for Gold Price Movement
Bullish Scenario
If the price breaks above 3073.07 USD and holds, momentum could carry it to test the next resistance zones around 3085 – 3092 USD. This would require dovish commentary from the Fed or weaker-than-expected economic data.
Bearish Scenario
If resistance at 3073.07 holds and price breaks below 3061.80, we could see a drop toward 3035 USD, followed by 3028.55 USD and possibly extending to 2983.50 USD.
Neutral Scenario
If price remains trapped between 3065 – 3035 USD, it would suggest market indecision ahead of the FOMC minutes and key inventory data.
Trading Recommendations
- Sell on rally: Near 3065–3073 USD with targets at 3035 and 3028.
- Buy on dip: Only near 2983–3028 USD if support holds and momentum recovers.
- Avoid entry around major data release times without confirmation.
FAQs – Gold (XAUUSD+) Analysis
1. Is gold likely to continue higher after 3073?
Only if upcoming data supports dovish monetary policy and risk appetite rises. Otherwise, 3073 may cap the rally.
2. What role does the U.S. dollar play in gold movement?
A strong dollar tends to pressure gold lower, while a weaker dollar supports gold’s price.
3. What makes 3028.55 a key level?
It’s an MD (mid-day) pivot derived from mathematical models used in intraday institutional trading.
4. How can I use economic news in trading gold?
Track high-impact news like FOMC minutes and inflation data—they move the dollar, which in turn moves gold.
5. Is this analysis valid across all timeframes?
This analysis is based on M15. The higher the timeframe, the broader the outlook. For swing trades, refer to H1 or H4.
Conclusion
The current technical structure on XAUUSD+ suggests a possible short-term top near 3073, with signs pointing toward a corrective phase if resistance holds. However, all eyes are on today’s U.S. economic data, especially the FOMC minutes. Traders should stay nimble and align positions with both technical signals and real-time market reactions.
Try Our product :
