


Markets are more than just numbers—they move in SQ9 Shapes and cycles. In Gann theory, certain time-based geometric forms reflect phases of movement, volatility, and trend reversals. These shapes—hexagons, squares, pentagrams, circles—are more than academic: they offer practical tools to anticipate what the market will do next. In this article, we explore the properties of each time shape, how they’re formed, and when to use them in your trading.
🔷 Hexagonal and Angular Time Forms
Hexagons (60° angles) and related shapes like octagons (45°) or nonagons (30°) are considered slow-moving formations. They often appear during:
- Holidays
- Weekend gaps
- Pre/post-market hours
- Market indecision zones
Because of their low momentum, these forms should be avoided for active entries. They’re best used to identify market stagnation and prepare for larger upcoming moves.
Key Takeaway: These are signs of low liquidity and should be monitored—not traded through.
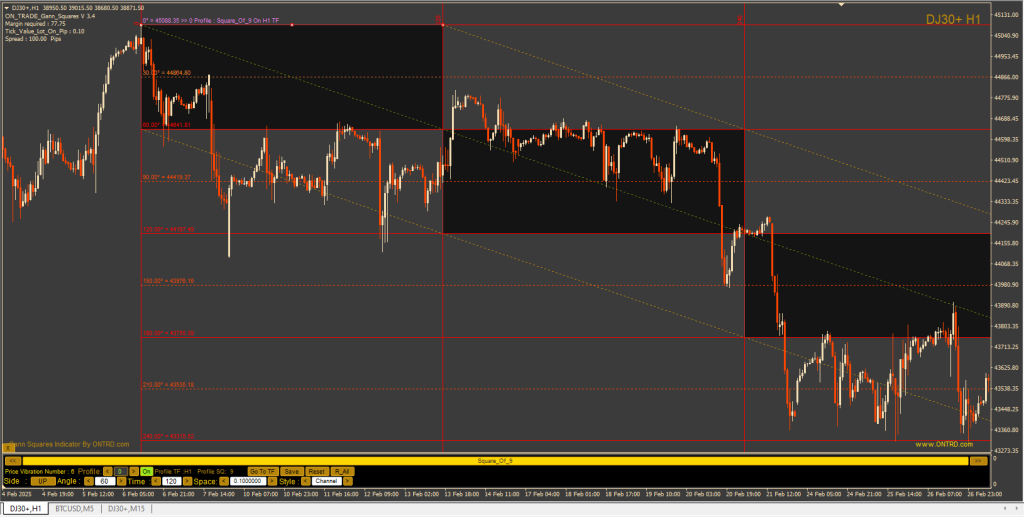
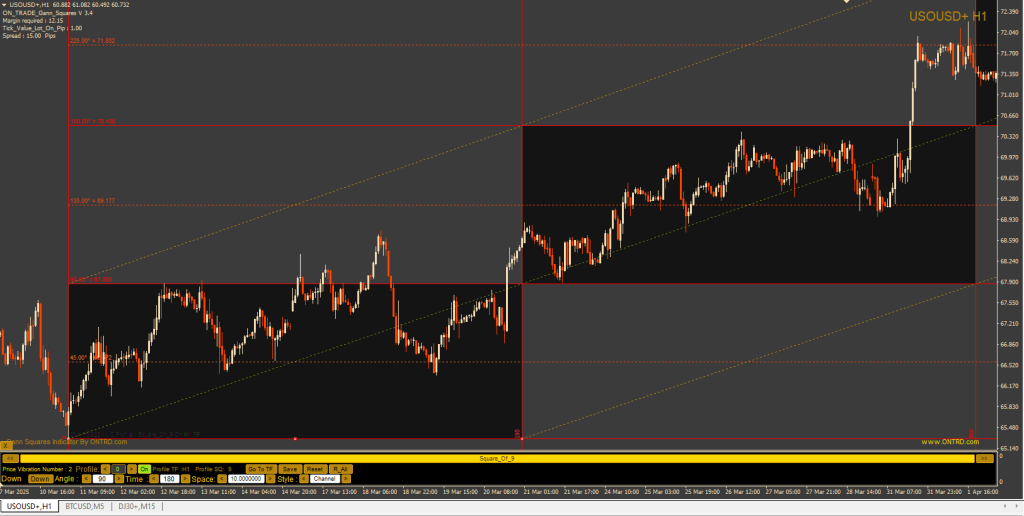
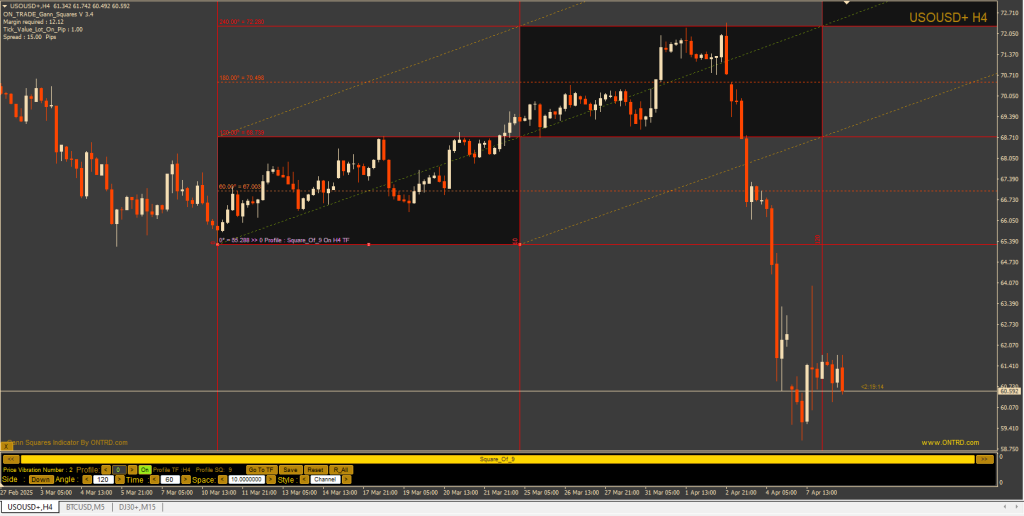
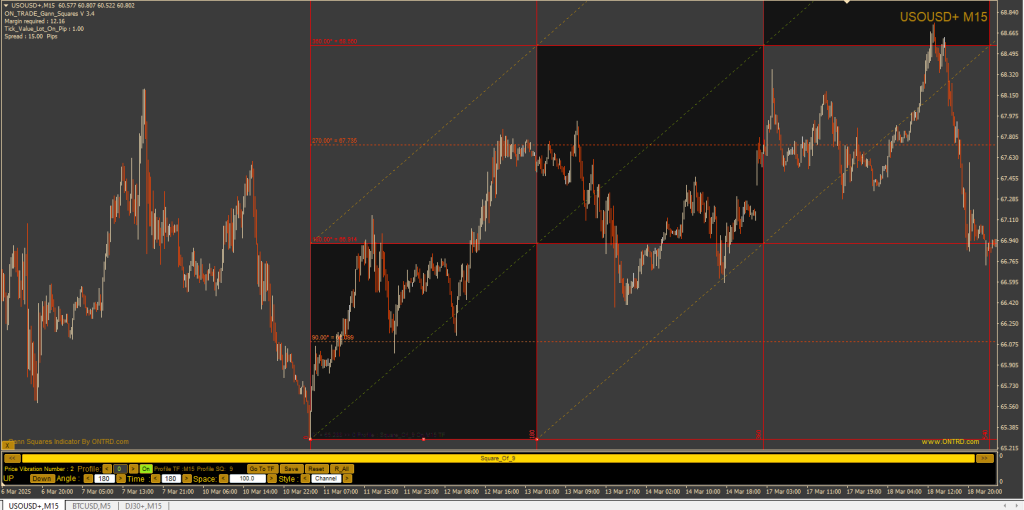
◼️ Squares and Pentagrams: Reliable Patterns
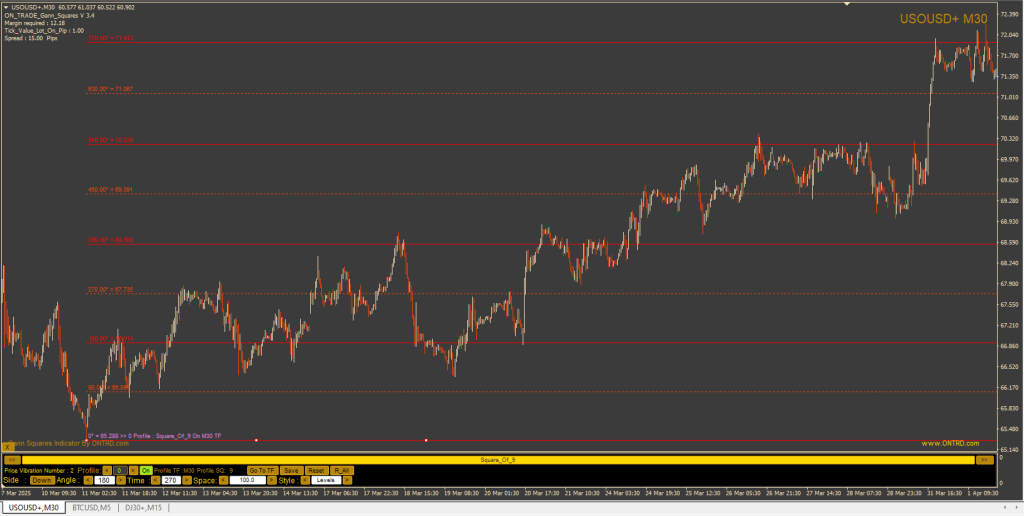
These shapes, formed at 90° (square) and 72° (pentagram), represent stable and tradable cycles.
Their characteristics:
- Occur in 70% of market movements
- Provide calm, steady motion
- Traders can profit with confidence using structured entry rules
These are the sweet spots for technical traders, where market structure is predictable. They align with common Gann angle strategies and are often used in entry-retest-exit models.
🔺 Triangle-Based Forms: The Triples
When formed around 120° angles, triple shapes provide moderate speed and are generally complete within a third to half of a Gann cycle.
Best practices include:
- Entering on the retest of the 120° angle
- Monitoring for failures if price closes outside your expected zone
They offer efficient entry zones, but the trader must act quickly due to their shorter duration compared to squares.
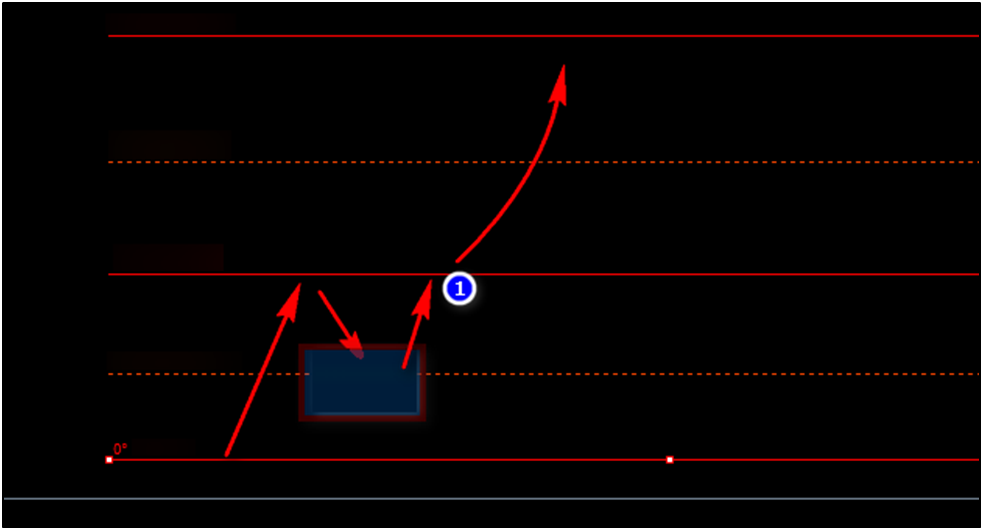
📈 180° Straight Angle Form
This shape signifies sudden bursts of momentum, often during:
- Economic data releases (e.g., NFP, interest rate decisions)
- Oil inventory news
- Geo-political events
Traits:
- High volatility
- Fast entries and exits required
- Best used on lower timeframes
Stops must be placed tightly, as movement is strong but can reverse sharply if fundamentals change.
🌀 Circular Shape: The Most Powerful Pattern
This form, built around the 270° angle, is the most dynamic of all. It’s frequently seen in:
- Crises or black swan events
- Sharp market rebounds
- Flash crashes or recoveries
It usually follows two paths:
- Ideal: From 270° to 180°, then 90°, then a final push to 360°
- Anomalous: Breaks through 270° immediately → heads to 450° or even 630°
In both cases, knowing when to exit is critical. Entry points are typically around 180° or 90° with a fixed target at 360°.
📊 Managing Anomalies and Angle Reactions
Certain angular points (e.g., 144°, 120°, 135°, 315°) are prone to temporary price reactions—these are “alert zones.” They often signal:
- Temporary retracements
- Low-volume corrections
- Potential trend flips
Understanding these levels allows traders to:
- Time entries during exhaustion phases
- Exit positions before major reversals
🧠 Strategic Takeaways
- Avoid hexagonal and octagonal shapes for active trading.
- Focus on square and pentagram patterns for consistent setups.
- Use triples and circular forms for speed-based strategies.
- Monitor angle overlaps for price clusters and decision points.
When used correctly, time shapes help visualize the tempo and rhythm of price action—offering clues that traditional indicators miss entirely.
🔚 Conclusion of SQ9 Shapes
Time Shapes in Gann theory offer a unique lens into market mechanics. By understanding the geometry of movement, you can align with market rhythms and time your trades with greater accuracy. Whether it’s a stable square or a volatile circular swing, each form provides insight into what the market is trying to tell you.
When combined with Gann Squares, Time Price Channels, and Fan Tools, these patterns create a robust forecasting system—where both time and price dance to a structured rhythm.
Best and only Indicator that can draw Square of nine shapes is ON Trade Gann Squares .


