
Price range: 75 $ through 100 $
Description
Introduction to Supply and Demand in Forex
The supply and demand concept is a fundamental principle of the Forex market. Every price movement reflects the ongoing battle between buyers and sellers. When demand exceeds supply, prices rise; when supply surpasses demand, prices fall. Identifying supply and demand zones is essential for traders as these areas indicate potential reversal or continuation points in the market.
One of the best tools available for recognizing these crucial levels is the ON Trade Supply & Demand Indicator. This indicator automatically detects and plots supply and demand zones on the chart, allowing traders to make more informed decisions. In this guide, we will explore the concept of supply and demand, the importance of these zones, and how to effectively use the ON Trade Supply & Demand Indicator to enhance your trading strategy.
What Are Supply and Demand Zones?
Supply and demand zones are price levels where a strong imbalance between buyers and sellers previously caused a significant price movement. These zones often act as support and resistance levels, influencing future price action.
Supply Zone vs. Demand Zone
🔹 Supply Zone (Resistance Area): A price level where selling pressure is high, preventing further price increases. When the price reaches this zone, sellers dominate, pushing the price downward.
🔹 Demand Zone (Support Area): A price level where strong buying interest halts a price decline and pushes it back up.
How to Use These Zones in Trading?
- Identify optimal entry and exit points in the market.
- Place stop-loss orders strategically based on price reactions at these zones.
- Improve risk management by trading near strong supply and demand levels.
Why Do You Need the ON Trade Supply & Demand Indicator?
The default tools available in trading platforms like MetaTrader 5 do not include an automatic indicator for identifying supply and demand zones. This is where the ON Trade Supply & Demand Indicator becomes invaluable. It eliminates the need for manual zone identification, saving time and increasing accuracy.
Key Features of the ON Trade Supply & Demand Indicator
✅ Automated Identification of Supply and Demand Zones – No need to manually draw levels.
✅ Multi-timeframe Analysis – Works effectively on higher timeframes to reduce market noise.
✅ Different Zone Strengths – Highlights weak, untested, verified, proven, and turncoat zones.
✅ Customizable Settings – Allows traders to adjust sensitivity and display preferences.
✅ Compatible with Price Action Trading – Can be used with candlestick patterns and other strategies.
Types of Supply and Demand Zones Identified by ON Trade Supply & Demand Indicator
The ON Trade Supply & Demand Indicator classifies zones based on how price has interacted with them in the past. Understanding these classifications is crucial for making better trading decisions.
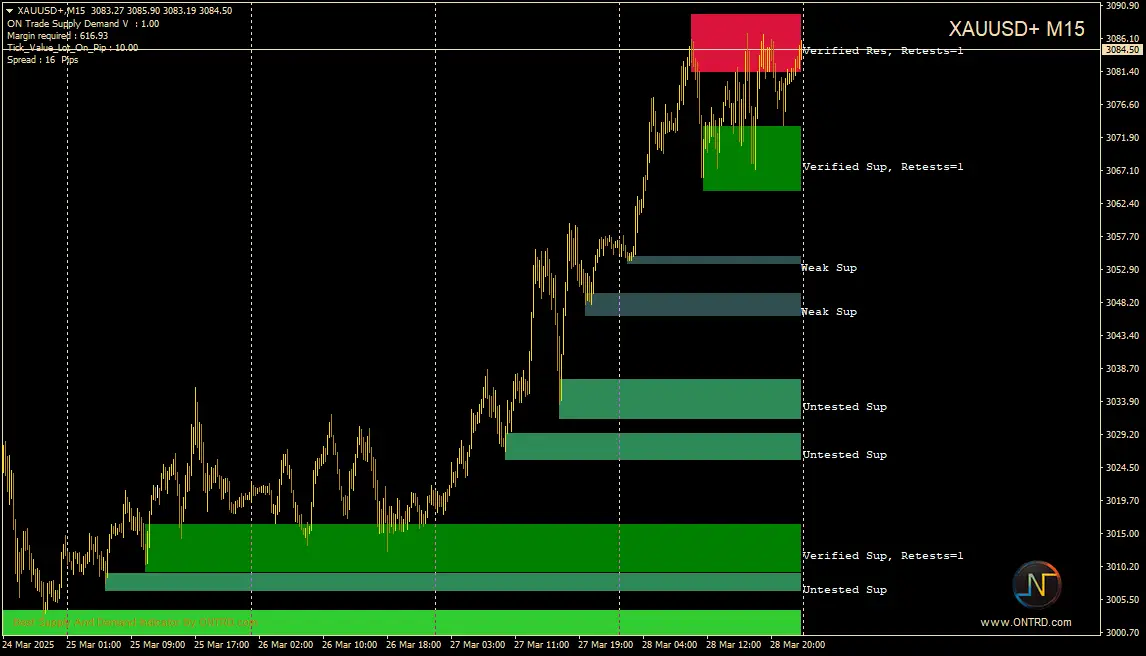
1. Weak Zone
A weak supply or demand zone is one that has not yet established itself as a strong level of interest among traders. These zones have not shown significant reactions in the past and should be approached with caution.
🔹 Trading Tip: Avoid placing major trades at weak zones unless confirmed by other indicators.
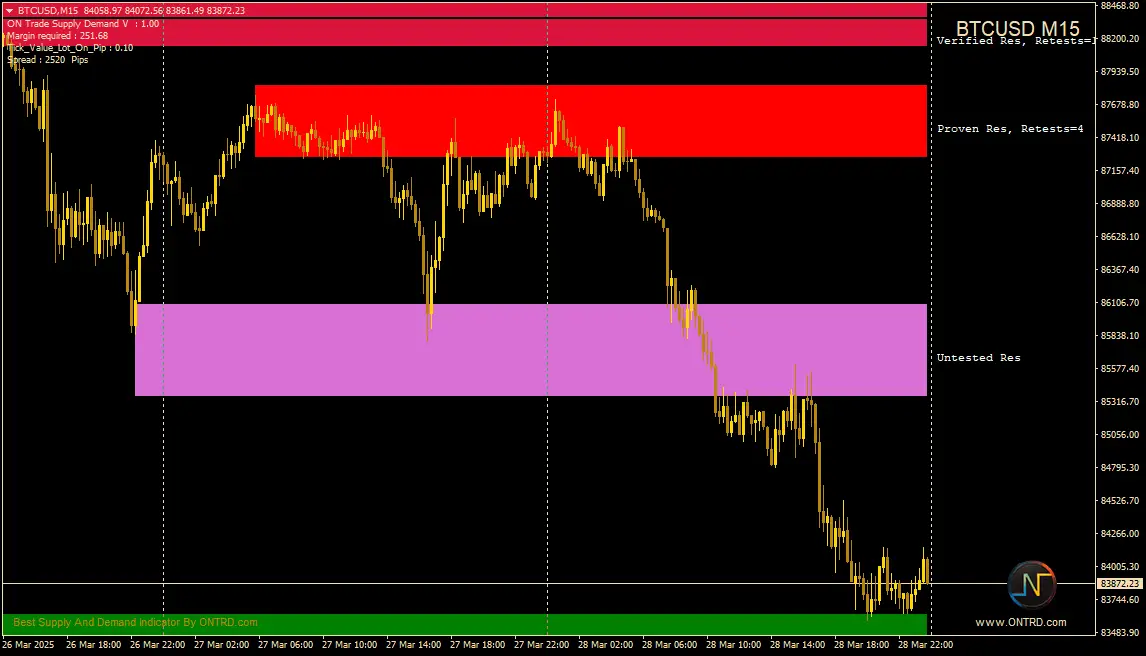
2. Untested Zone
An untested zone represents a fresh supply or demand level where the price has only moved strongly from it once, but it has not been retested.
🔹 Trading Tip: These zones have the potential to hold, but they need additional confirmation.
3. Verified Zone
A verified zone is a supply or demand area that has been tested at least twice, indicating that it has held firm in the past.
🔹 Trading Tip: The more times a zone is tested, the more significant it becomes.
4. Proven Zone
A proven zone has been tested multiple times and continues to influence price movement, making it one of the strongest levels for trading decisions.
🔹 Trading Tip: These zones provide high-probability trade setups and should be closely monitored.
5. Turncoat Zone (Flip Zone)
A turncoat zone, also known as a “flip level,” is a supply zone that turns into a demand zone (or vice versa) due to a shift in market conditions.
🔹 Trading Tip: Turncoat zones are highly significant as they indicate a change in trend direction.
How to Trade Using the ON Trade Supply & Demand Indicator?
1. Trading Supply and Demand Bounces
One of the most effective ways to trade supply and demand zones is to wait for price to reach a strong zone and bounce off it.
🔹 Strategy:
- Look for a verified or proven supply/demand zone.
- Wait for a clear price rejection (such as a pin bar or engulfing candle).
- Enter the trade with a stop-loss below the demand zone (for buy trades) or above the supply zone (for sell trades).
2. Breakout and Retest Strategy
Another common approach is to trade breakouts of supply and demand zones followed by a retest.
🔹 Strategy:
- Identify a strong supply or demand zone that has been tested multiple times.
- Wait for a breakout above the supply zone (for bullish trades) or below the demand zone (for bearish trades).
- Enter a trade when the price retests the broken zone and confirms the new direction.
3. Combining with Other Indicators
To increase accuracy, traders often use the ON Trade Supply & Demand Indicator with:
✅ Moving Averages – To confirm trend direction.
✅ RSI (Relative Strength Index) – To detect overbought and oversold conditions.
✅ MACD (Moving Average Convergence Divergence) – To identify momentum shifts.
Common Mistakes Traders Make with Supply and Demand Zones
🔴 Ignoring Higher Timeframes: Always analyze supply and demand zones on higher timeframes to reduce false signals.
🔴 Trading Every Zone: Not all zones are strong; focus on verified and proven zones.
🔴 Ignoring Market Context: Consider overall trend direction and fundamental factors before entering trades.
🔴 Setting Tight Stop-Losses: Give your trade room to breathe by placing stop-loss orders slightly beyond the supply or demand zone.
Final Thoughts: Why ON Trade Supply & Demand Indicator is Essential for Forex Traders
The ON Trade Supply & Demand Indicator is a powerful tool for identifying high-probability trading zones. By understanding how supply and demand impact market movements and using this indicator correctly, traders can:
✅ Identify strong market levels with high accuracy.
✅ Improve entry and exit timing.
✅ Enhance risk management strategies.
✅ Increase their chances of profitable trades.
Whether you’re a beginner or an advanced trader, incorporating supply and demand analysis into your strategy can significantly improve your trading success. Start using the ON Trade Supply & Demand Indicator today and take your Forex trading to the next level! 🚀
🔎 Key Takeaways
📌 Supply and demand zones act as crucial support and resistance levels.
📌 The ON Trade Supply & Demand Indicator automatically identifies and plots these zones.
📌 Different zone types (weak, verified, proven, etc.) provide varying levels of reliability.
📌 Trading strategies include bounces, breakouts, and combining with other indicators.
📌 Avoid common mistakes like trading every zone or ignoring the higher timeframes.
Would you like to see an example of the ON Trade Supply & Demand Indicator in action? Let me know, and I can guide you through a live chart analysis! 📊🔥
For More Info Contact Us .
Reference For Supply and Demand on wiki
1 Review
good supply and demand indicator
Additional information
| Payment Details | Life Time, 1 Year, 5 Days Test |
|---|
Related products
-

ON Trade Currency Strength Indicator
Price range: 80 $ through 150 $ Select options This product has multiple variants. The options may be chosen on the product page -

ON Trade Hikkake Pattern Indicator – A 1st Powerful Tool for Traders
Price range: 5 $ through 35 $ Select options This product has multiple variants. The options may be chosen on the product page -

ON Trade Candle Arrow – 1st Unlock Precision Trading
Price range: 75 $ through 125 $ Select options This product has multiple variants. The options may be chosen on the product page -

ON Trade Japanese Candles – Advanced Price Action Indicator
Price range: 5 $ through 50 $ Select options This product has multiple variants. The options may be chosen on the product page