The Gartley Pattern: A Comprehensive Guide
Introduction to the Gartley Pattern
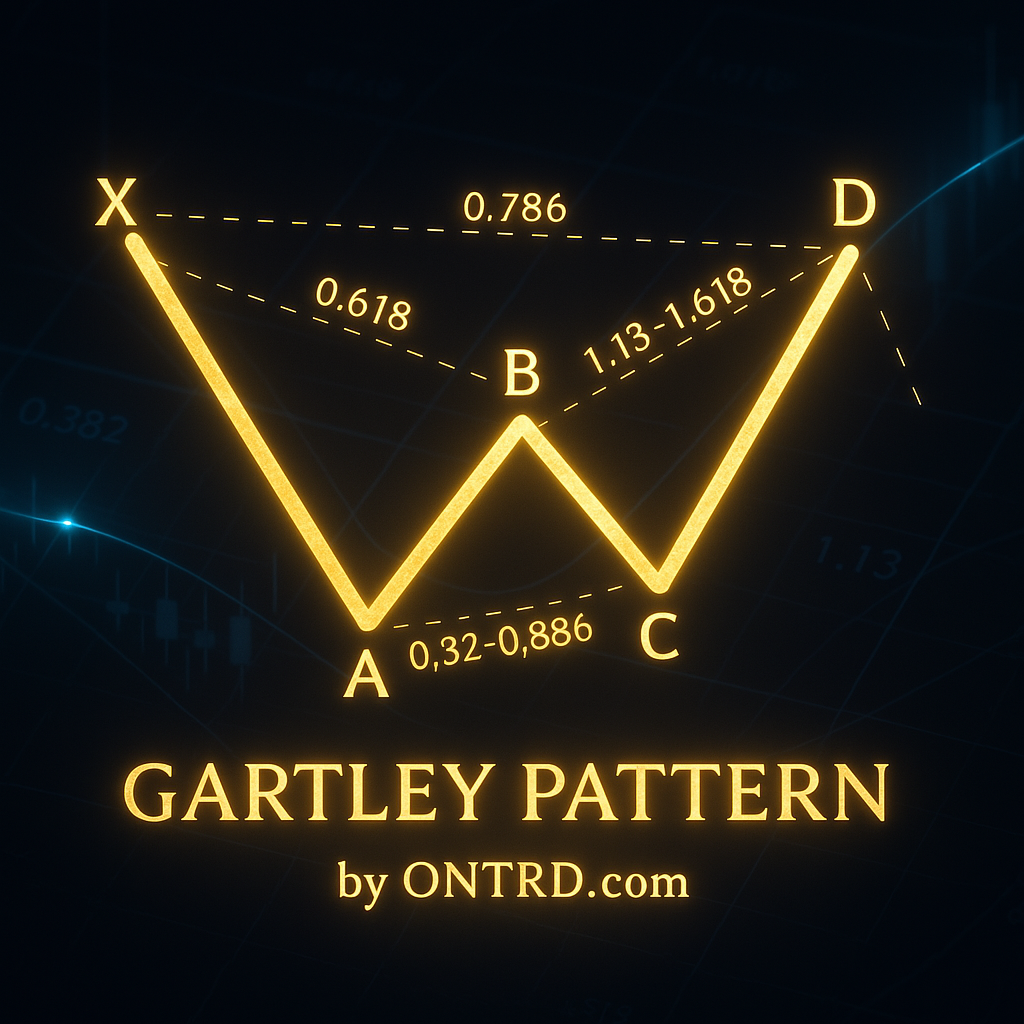
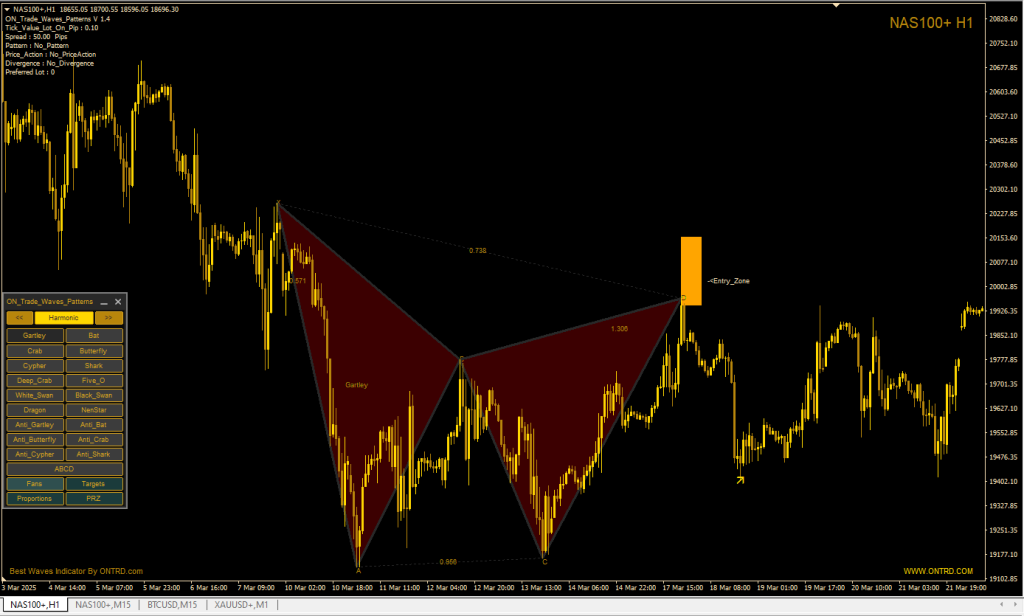
The Gartley Harmonic pattern is one of the most well-known harmonic patterns used in technical analysis. It was first introduced by Harold M. Gartley in his book Profits in the Stock Market (1935). This pattern is designed to help traders identify potential market reversals based on Fibonacci retracement and extension levels. The Gartley Harmonic pattern is characterized by an X-A-B-C-D structure and is often referred to as the “Gartley 222” due to its reference in his book on page 222.
Structure of the Gartley Pattern
The Gartley Harmonic pattern consists of five key points forming an M-shape (bullish pattern) or a W-shape (bearish pattern) on the chart. The structure follows specific Fibonacci ratios:
- XA Leg: The initial price movement.
- AB Leg: A retracement of the XA leg, ideally reaching 61.8%.
- BC Leg: A reversal from B, typically reaching 38.2% to 88.6% of the AB leg.
- CD Leg: The final leg, extending 127.2% to 161.8% of BC.
- D Point (Potential Reversal Zone – PRZ): Forms at 78.6% retracement of XA and serves as the entry point.
Identifying the Gartley Pattern
To confirm a valid Gartley pattern, traders should check:
- AB retracement: Must be close to 61.8% of XA.
- BC extension: Should range between 38.2% and 88.6%.
- CD leg: Should align with the 127.2% to 161.8% extension of BC.
- D-point completion: Must be near 78.6% retracement of XA.
If all conditions are met, the pattern is considered valid, and traders can look for potential trade setups.
How to Trade the Gartley Harmonic Pattern
1. Entry Points
- A trade is placed at point D, where price action is expected to reverse.
- Confirmation tools like candlestick patterns (e.g., Doji, Engulfing, Pin Bar) can enhance reliability.
2. Stop Loss Placement
- Typically set below D (for a bullish setup) or above D (for a bearish setup).
- A common stop-loss level is beyond the 88.6% retracement of XA.
3. Profit Targets
- Target 1: The 38.2% retracement of CD.
- Target 2: The 61.8% retracement of CD.
- Target 3 (optional): A full retracement back to point A.
Using Fibonacci Ratios for Confirmation
Fibonacci tools play a crucial role in validating the Gartley Harmonic pattern. Traders use:
- Fibonacci retracements to confirm entry points and stop-loss levels.
- Fibonacci extensions to project profit targets.
- Fibonacci fans to predict trend direction.
Strengths and Weaknesses of the Gartley Harmonic Pattern
✅ Advantages:
- High accuracy when correctly identified.
- Clear entry, stop-loss, and target levels.
- Works in all markets (forex, stocks, crypto).
❌ Disadvantages:
- Requires patience and precise Fibonacci measurements.
- May fail if additional confirmations are ignored.
The Best product to detect Gartley Harmonic pattern is :
ON Trade Waves Patterns indicator .
