In Gann theory, few tools rival the Square of 144 in depth, structure, and forecasting ability. Known as the “King of Squares,” this powerful grid aligns price, time, and angle into one cohesive system. It is often extended to include the 90 Square and the 52 Square, giving traders the ability to project future market zones with near-mathematical precision.
This article breaks down the theory, setup, and trading methods behind these powerful Gann structures.

🧱 What is the Square of 144?
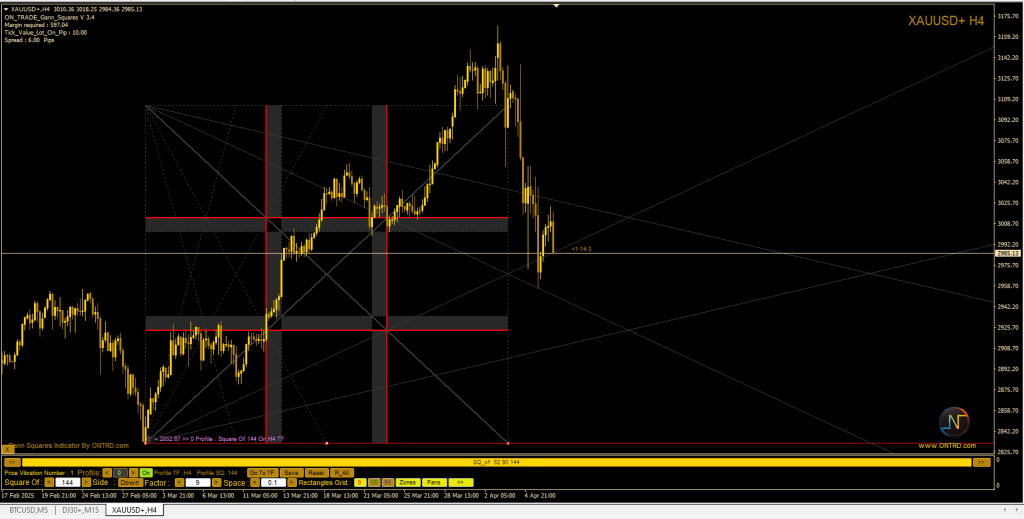
At its core, the Square of 144 is a grid of price and time intervals. It divides the chart into:

- Vertical time lapses
- Horizontal price levels
- Diagonal fan lines (Gann Fans)
These lines form a square matrix that helps traders:
- Forecast reversals
- Measure cycle strength
- Identify breakout levels
It’s particularly effective for detecting symmetry between price corrections and time cycles.
🔢 How to Build the 144 Square
The steps are methodical:

- Choose a valid top or bottom as your anchor point.
- Measure 144 to 288 candles for full cycle consideration.
- Plot vertical lines at specific time lapses:
- 48, 54, 90, 94, 144 candles
- Measure the price correction from the starting point, then multiply it by 3 to find the outer boundary of the square.
This forms the full box—the basis for all future analysis.
💡 Tip: The ON Trade Gann Squares indicator automates this process with just a click.
🎯 Why It’s Called “King of Squares”
The 144 Square has earned this title because:
- It harmonizes time and price better than any other Gann tool.
- It produces a self-contained trading environment.
- Each element (time lapse, price level, fan) acts as a reactive support/resistance structure.
It is a multi-use system: entries, exits, stop placements, and trend reversal points are all embedded within its design.
📏 Understanding the Grid
Once plotted, the Square of 144 contains:
- Horizontal lines: Price resistance/support zones
- Vertical lines: Time intervals (reversal zones)
- Diagonals: Momentum or trend lines (Gann fans)
This grid creates visual symmetry, which allows traders to read the rhythm of the market like a blueprint.
🔁 Trading Strategies Using the 144 Square
There are three core strategies:
1. Time-Price Harmony Strategy
- Watch for reactions where a price level and a time lapse intersect.
- Entry is triggered at these intersections with candlestick confirmation.
2. Fan Breakout Strategy
- If price breaks through a Gann fan line, target the next diagonal.
- Works well with momentum shifts and trend reversals.
3. Pure Time Strategy
- Rely solely on vertical lines to forecast reactions (without price levels).
- Especially useful during high volatility or news events.

⚙️ 90 and 52 Squares: Shorter Cycle Versions
The Square of 90 and Square of 52 are modified versions of the 144 Square, used on lower timeframes:
- 90 Square: Ideal for 5–15 minute charts
- 52 Square: Best for scalping or 1-minute analysis
They work using the same logic—just condensed for shorter market cycles.
🧠 Advanced Tips
- Use the center of the square as a hidden time lapse—it often signals major directional shifts.
- Confluence between fan lines and time zones is a high-probability setup.
- When price respects an angle like 144° or 72°, it confirms the grid’s integrity.
🔚 Conclusion
The Square of 144—and its cousins 90 and 52—are not just historical artifacts of Gann theory. They are living tools that continue to offer structure in a chaotic market. Once mastered, this grid becomes your trading battlefield, complete with predictable support zones, momentum indicators, and timing cues.
Whether you’re swing trading or scalping, this “King of Squares” offers an unparalleled level of control over your trade planning.
Best product to draw Gann Squares is ON Trade Gann Squares .


